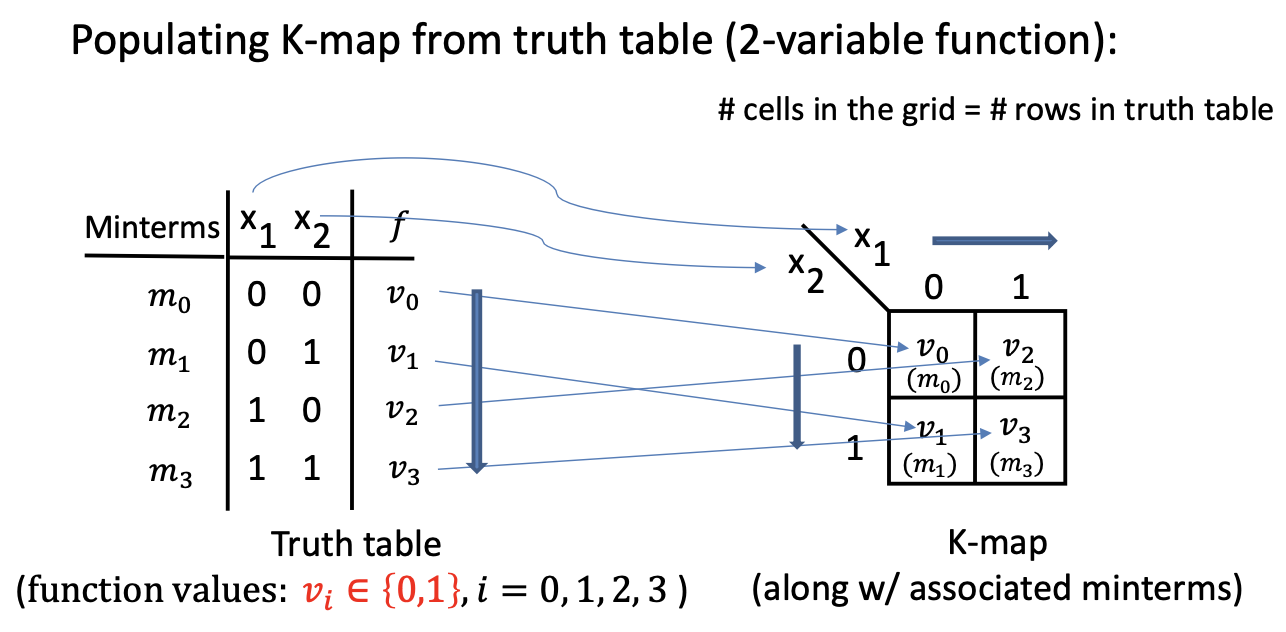
- A K-Map contains all the same information as truth table but in a different form
- Truth table is “tabular”, K-map is arranged as a grid of squares or cells
- The “coordinates” of a square represent the function’s input values
- The content of any square is the function’s output value for the corresponding coordinates/inputs
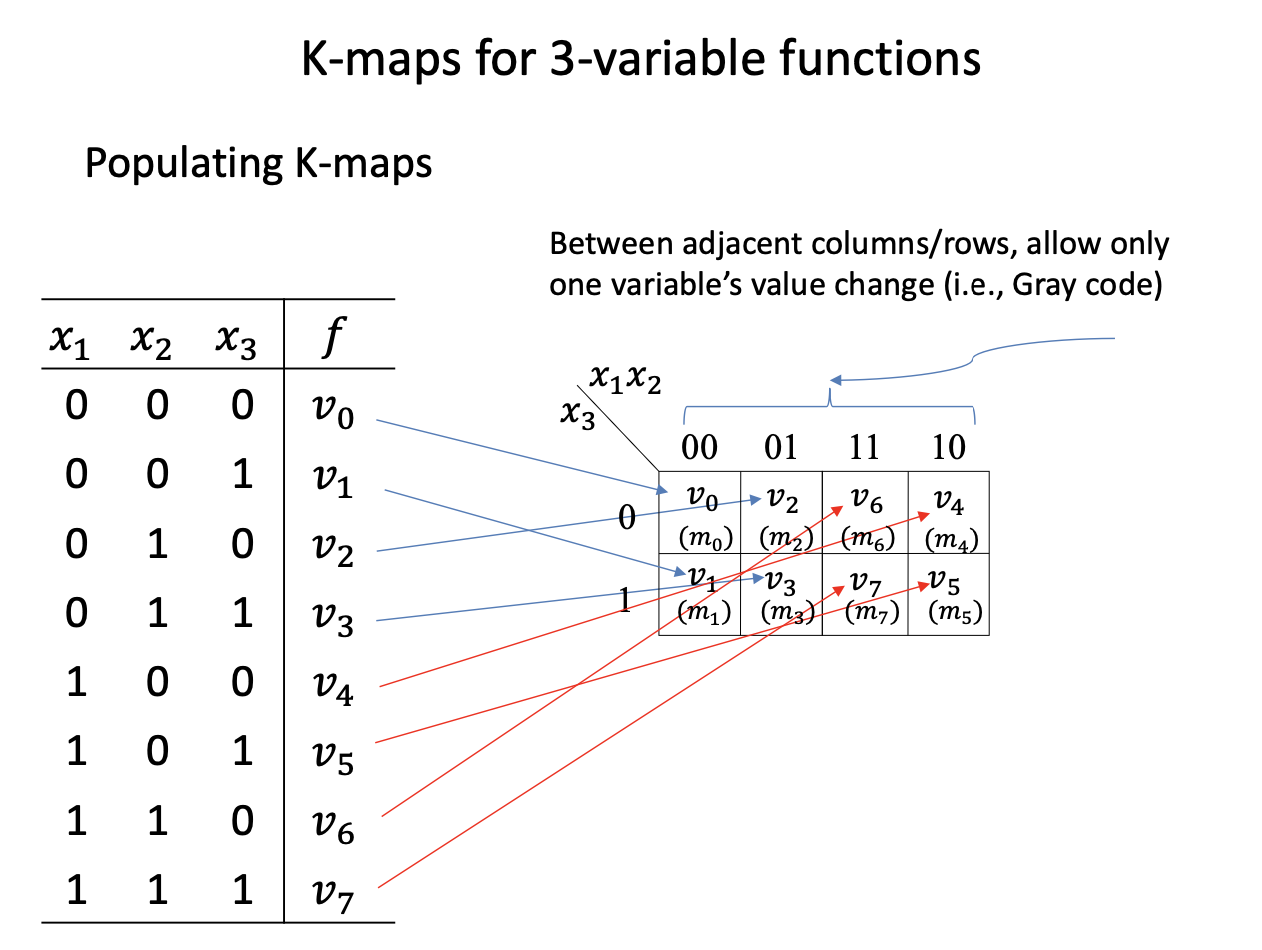
- The rows and columns of a K-map are labelled in a way so that only 1 variable changes between adjacent rows and columns
2-variable function
Example:
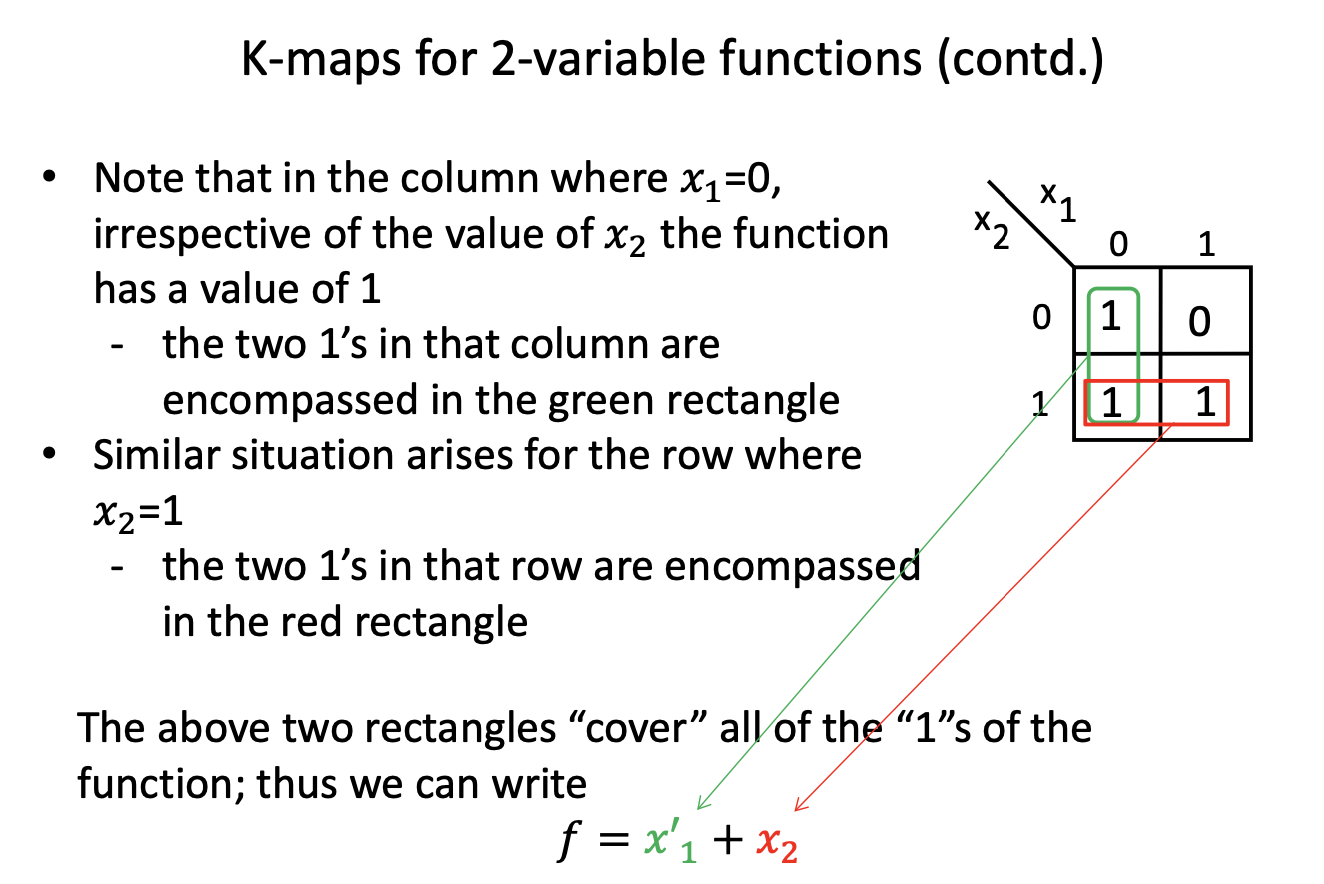
Alternative Algebraic Explanation:
The green rectangles encompass 2 “1”s corresponding to
Similarly the red rectangle encompasses 2 “1s” corresponding to
Thus the expression that covers all the “1”s in the K-map is
SOP simplification using K-maps
- For an SOP expression for the function, all “1“‘s in the K-map must be covered by one or more rectangles
- Find rectangles as large as possible covering “1”s noting that
- it’s ok if a “1” is covered by more than 1 rectangle
- the number of cells covered by a rectangle must be a power of 2, (e.g.
)
- For a low cost SOP expression, select as few rectangles as possible while ensuring to cover all of the “1”s in the K-map
- Possible to have multiple solutions that are equally as good
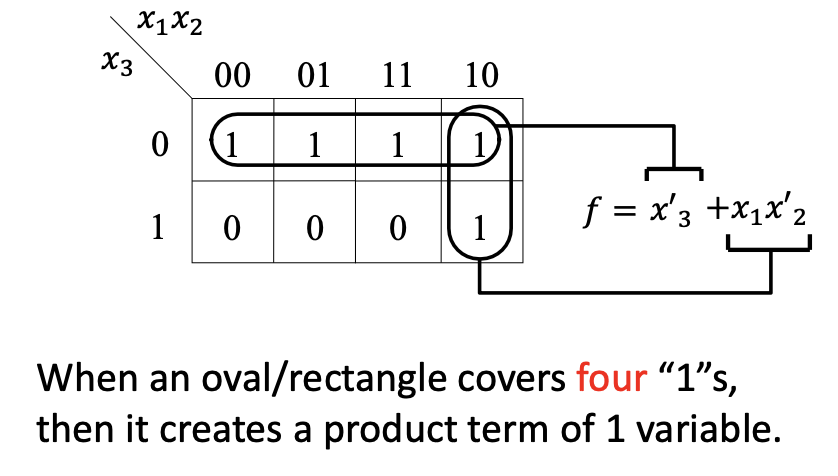
3-variable function
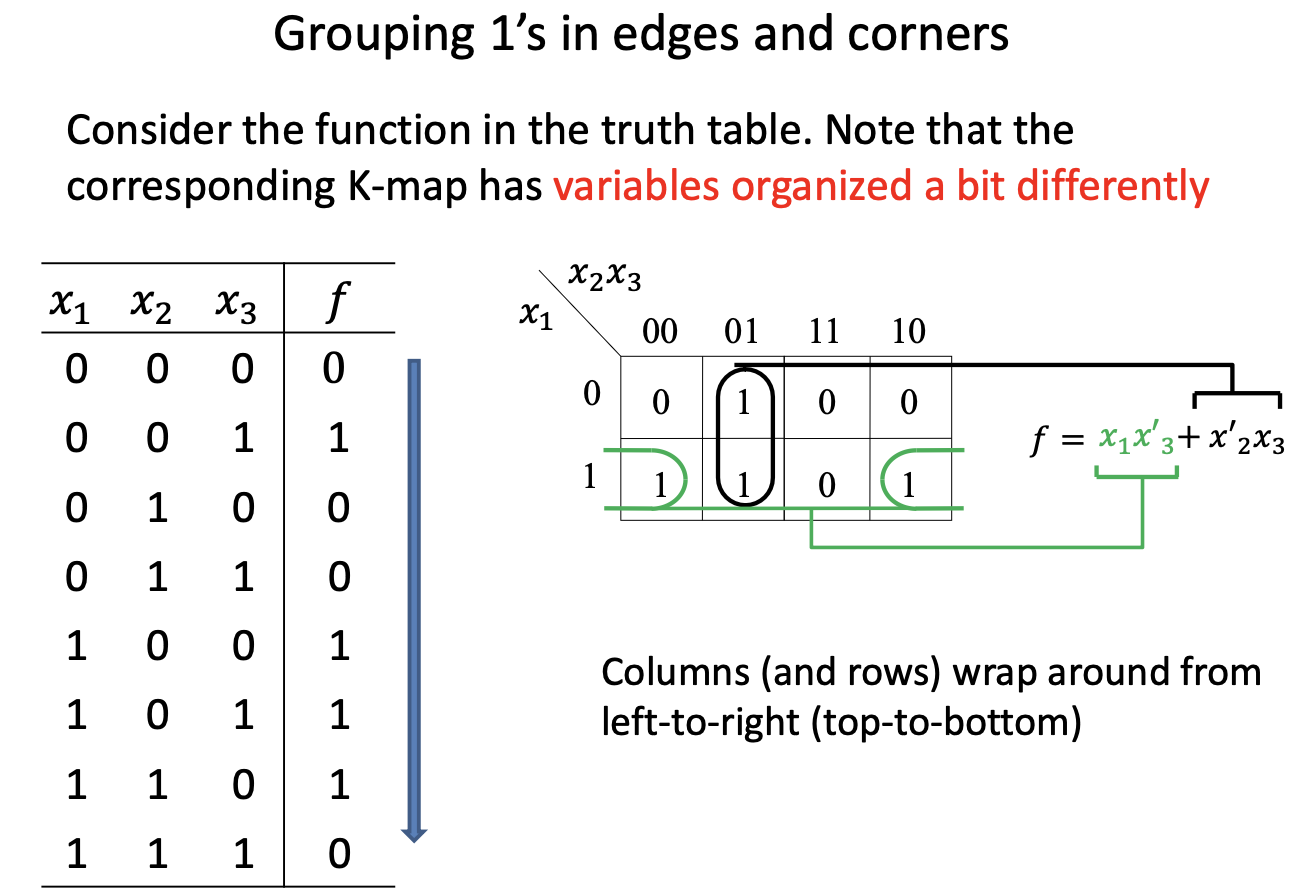
Grouping 1’s in edges and corners
Remarks on K-map
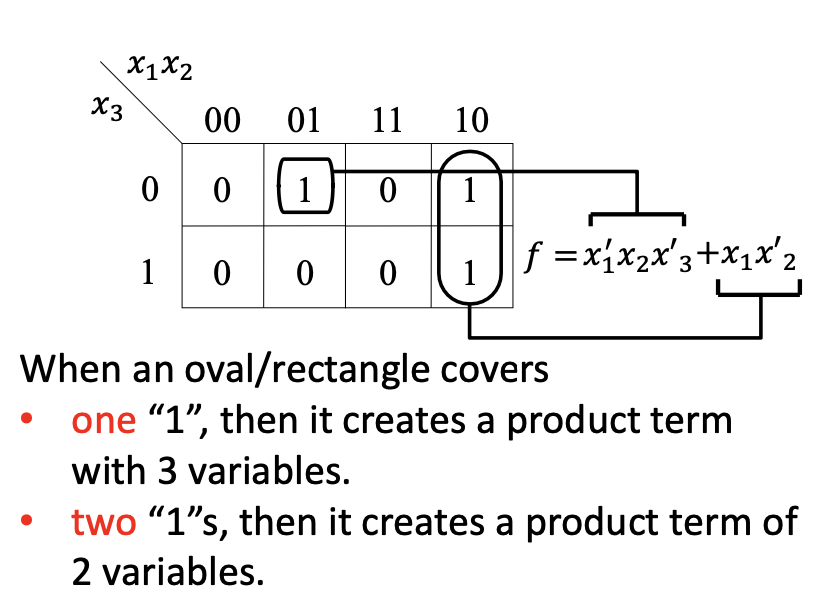
In general, for an n-variable function a rectangle/oval encompassing 1’s in
- 1 (
) square (i.e., cell) corresponds to a product term of n variables (i.e. minterm) - 2 (
) adjacent squares correspond to a product of n - 1 variables - 4 (
) adjacent squares correspond to a product of n - 2 variables - 8 (
) adjacent squares correspond a product of n - 3 variables