- State Diagram: Pictorial representation of a sequential circuit
- Graph consisting of nodes and directed arcs
- Nodes represent circuit states
- Arcs represent transition between states
- Graph consisting of nodes and directed arcs
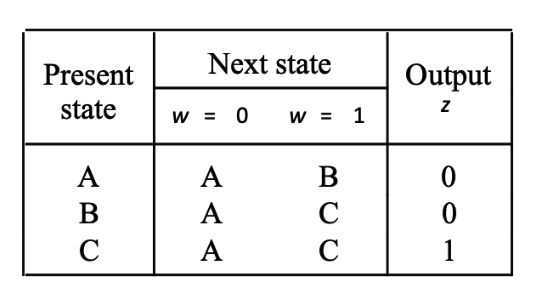
- State Table: Describes the behavior of a sequential circuit in tabular form
Example
Circuit Specification
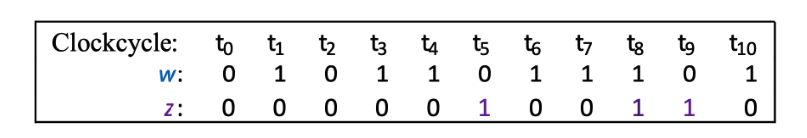
- The circuit has one input
wand one output `z - All changes in the circuit occur on the positive edge of a clock signal
- The output
zis equal to 1 if during two immediately preceding clock cycles the inputwwas equal to 1, otherwise the value ofzis equal to 0
State Diagram
State Diagram for the circuit specification given above
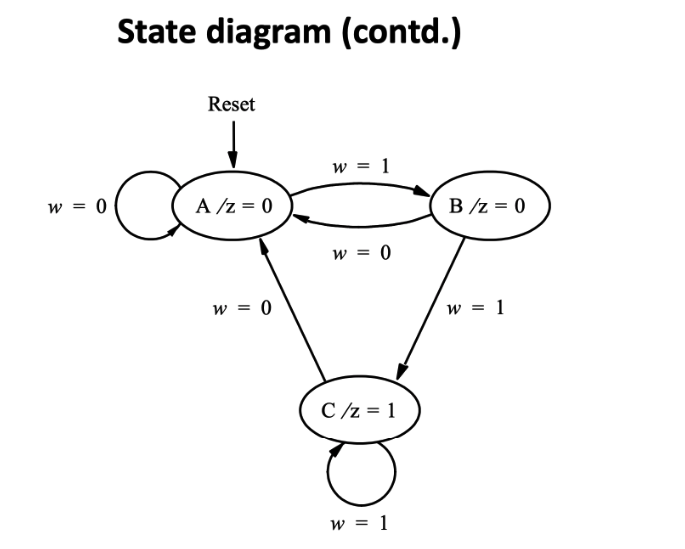
- Node A represents the starting state and it is also the state the circuit will reach after an input w = 0 is applied
- In this state, output z is 0, which is indicated as
A/z = 0in the node - The circuit remains in state A as long as w = 0 (indicated by an arc with a label w = 0 that originates and terminates at this node)
- In this state, output z is 0, which is indicated as
Number of arcs originate from a node is
Didn’t write the rest of them as it should be common sense from here…
State Table
State-assigned Table
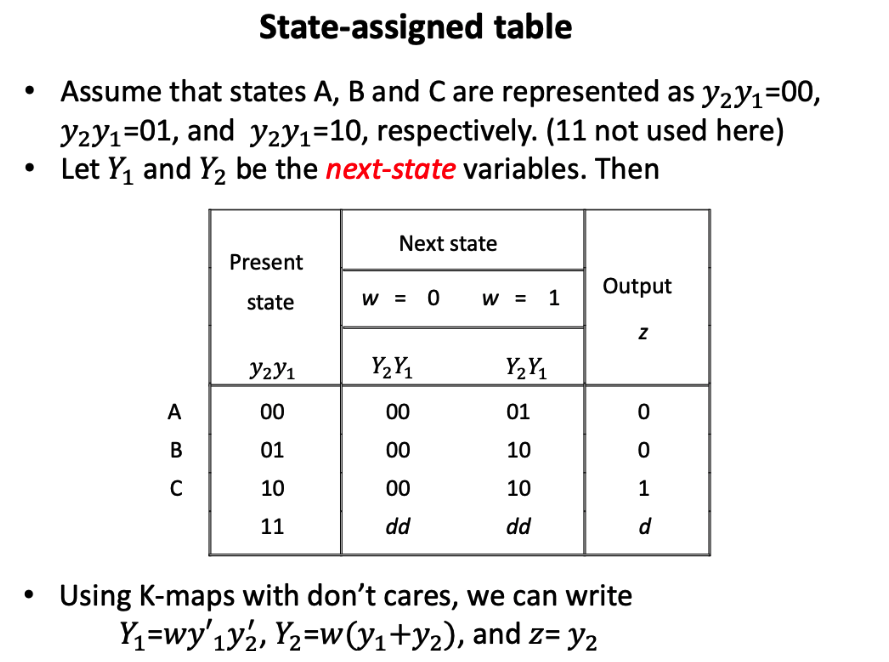
I don’t really get this well right now
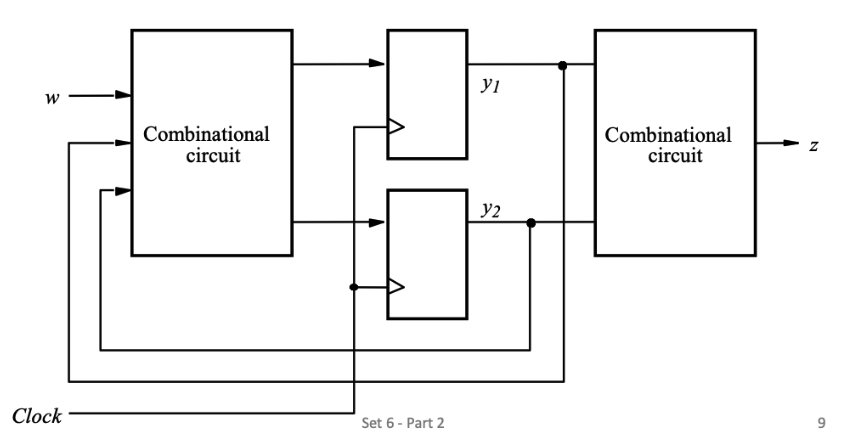
Circuit Block Diagram
Since there are 3 states in our example, at least 2 flip-flops are needed
Generic block diagram where