r = a cos
as the value of a gets bigger the diameter / radius of the circle also gets bigger
diameter = value of a
if a > 0 The circle is to the right of the origin else if a < 0 The circle is to the left of the origin
r = a sin
as the value of a gets bigger the diameter / radius also gets bigger
diameter = value of a
if a > 0 The circle is above the origin else if a < 0 The circle is below the origin
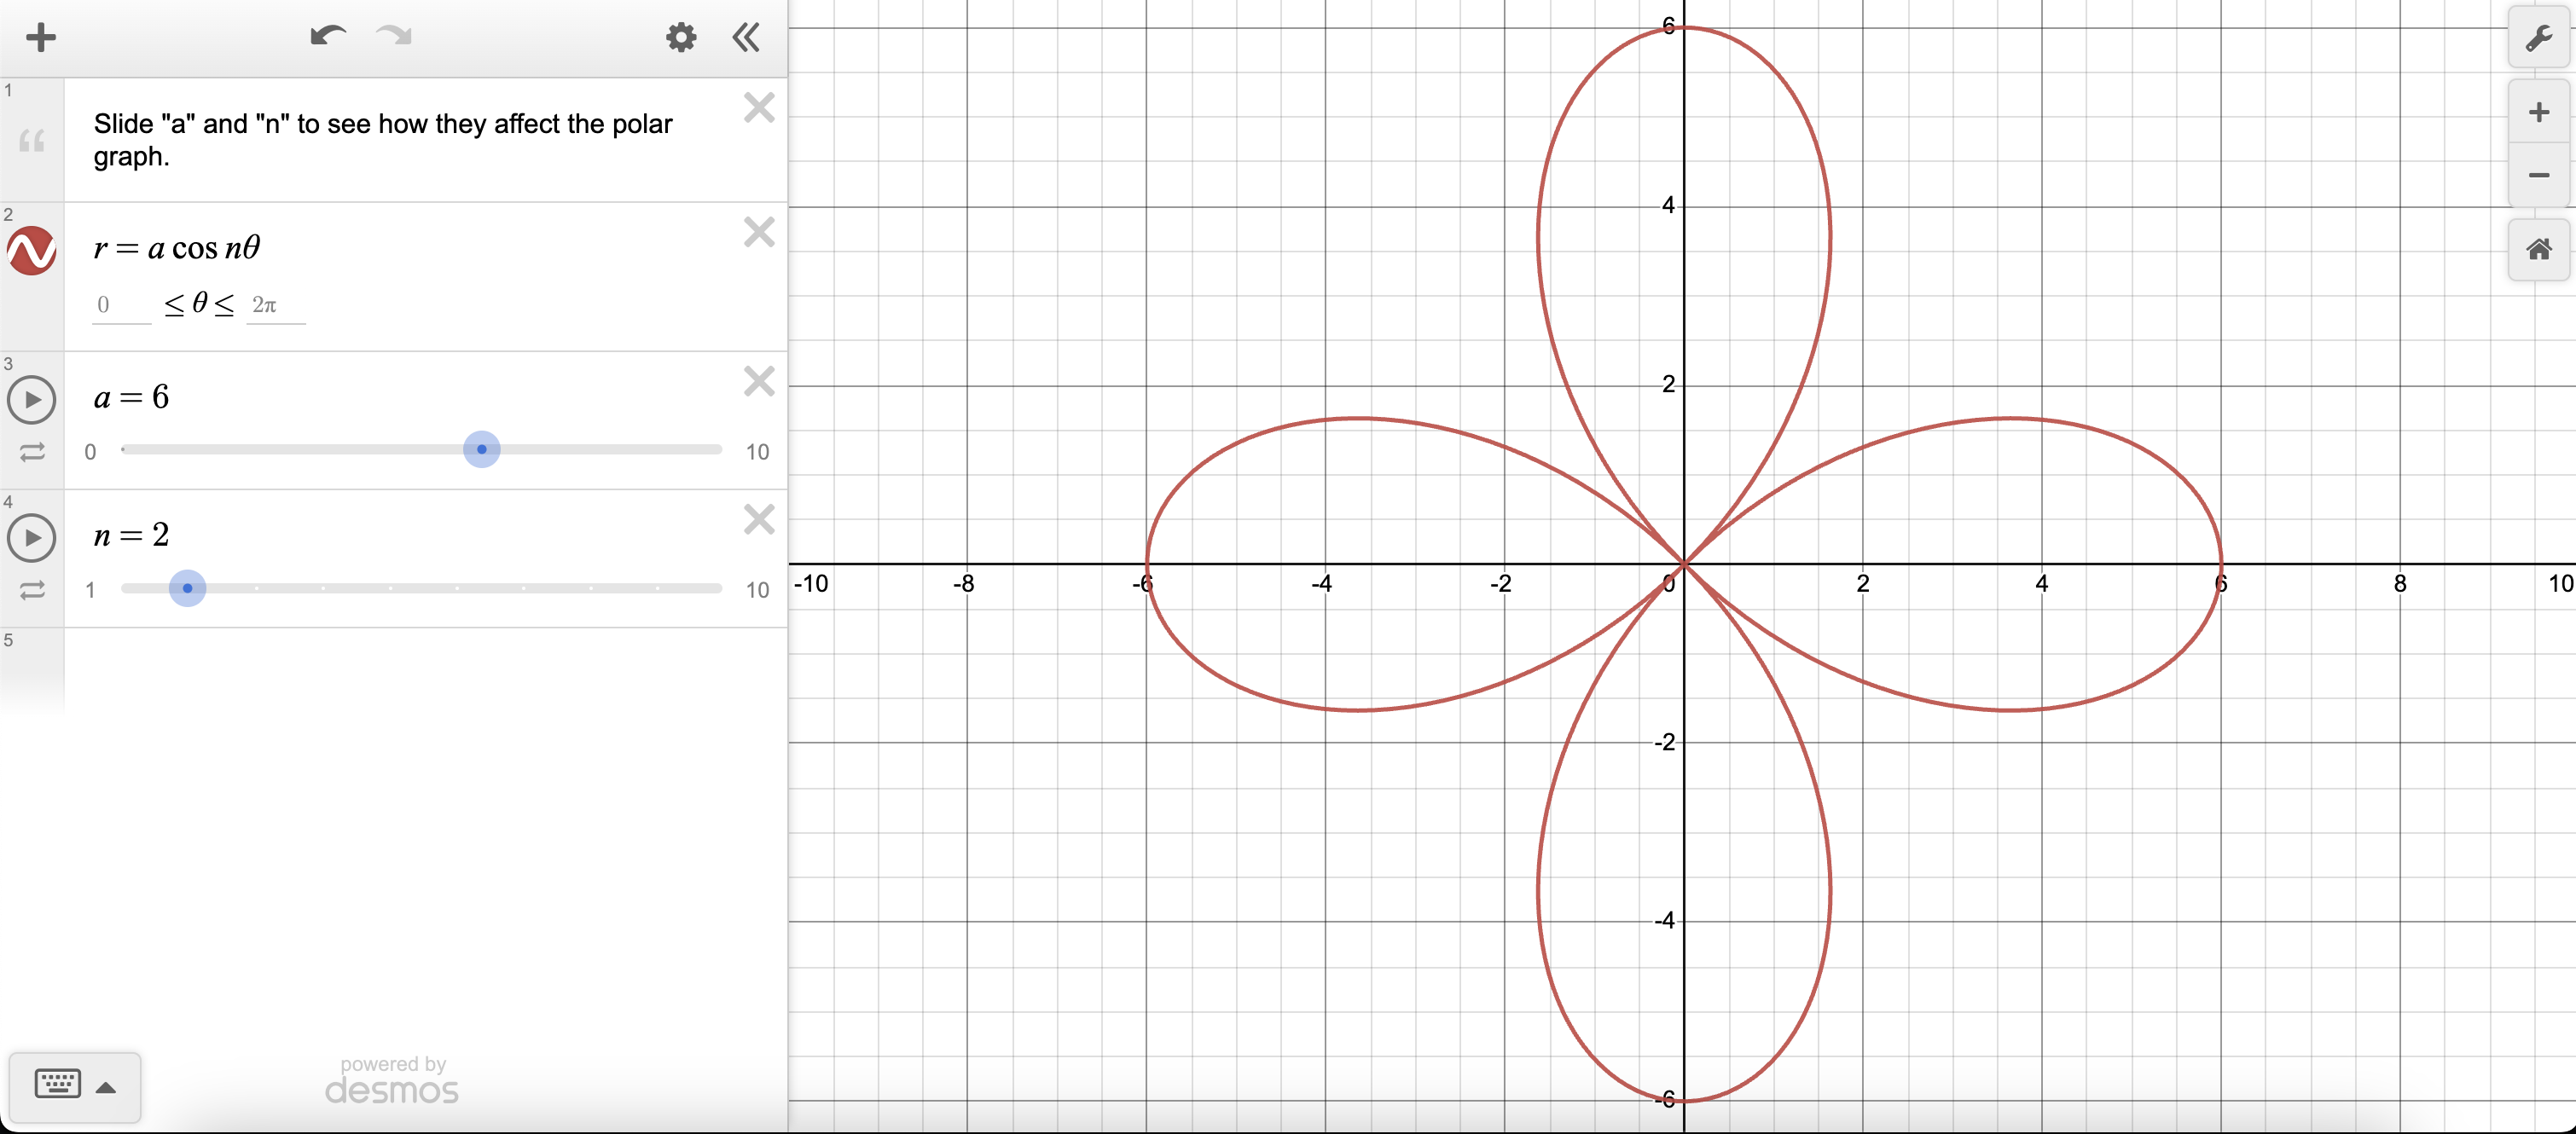
r = a cos n
These graphs are called Rose Curves
If the value of n is an even number then number of “loops” is 2n (Eg: if n is 2 then the number of loops is 4)
If the value of n is an odd number then the number of “loops” is n (Eg: if n is 3 then the number of loops is 3)
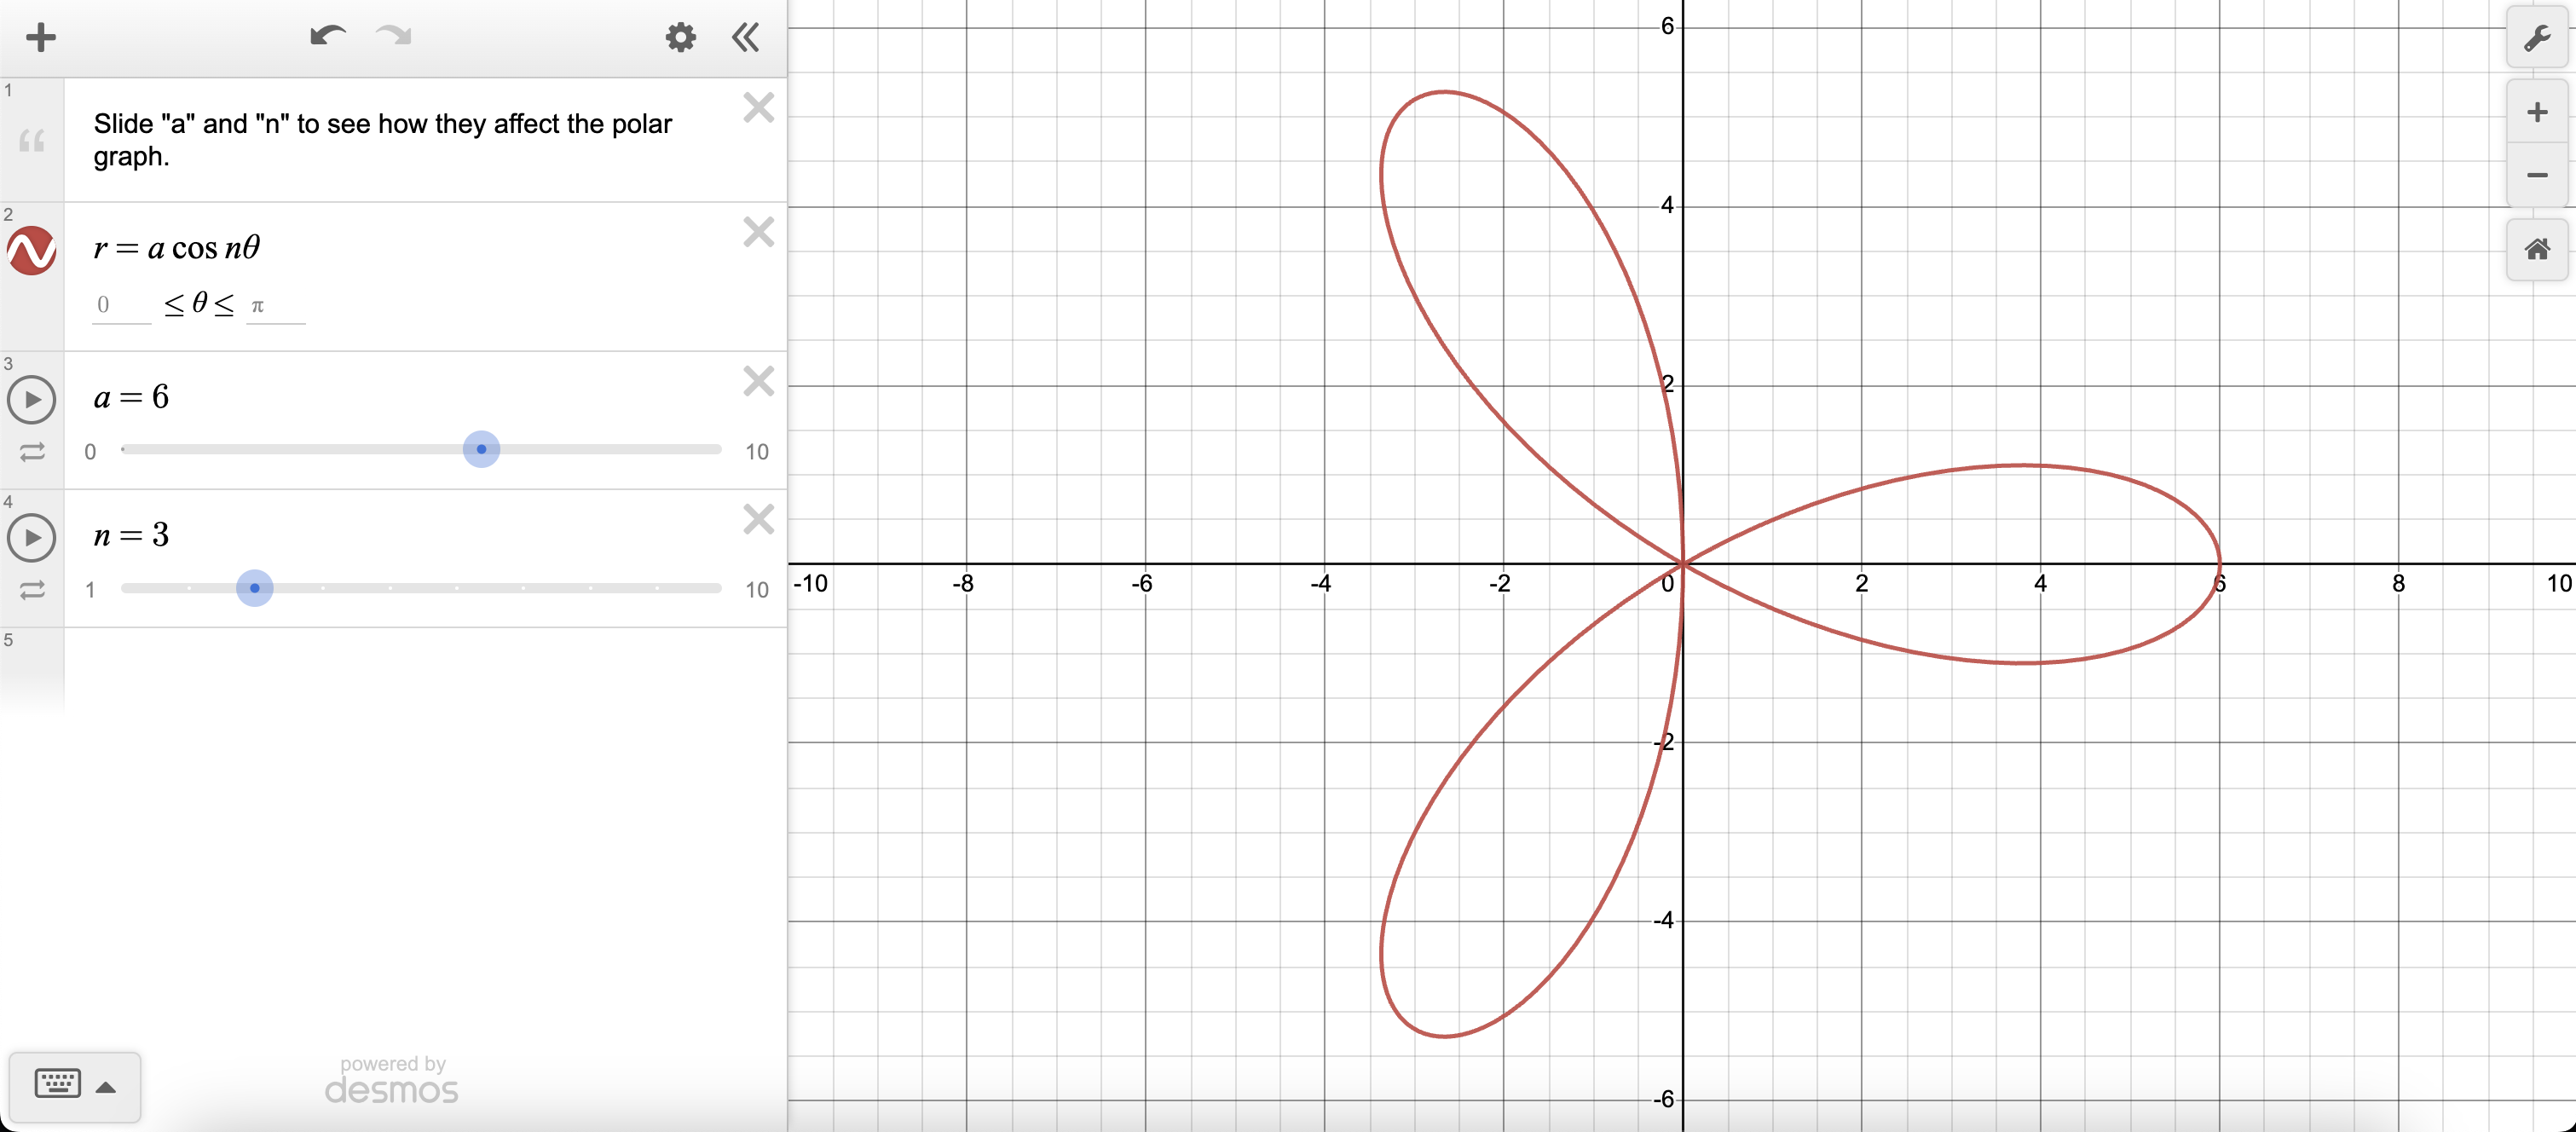
The diameter of each loop = a (doesn’t matter even or odd)
If n = 1 then it’s a normal circle graph
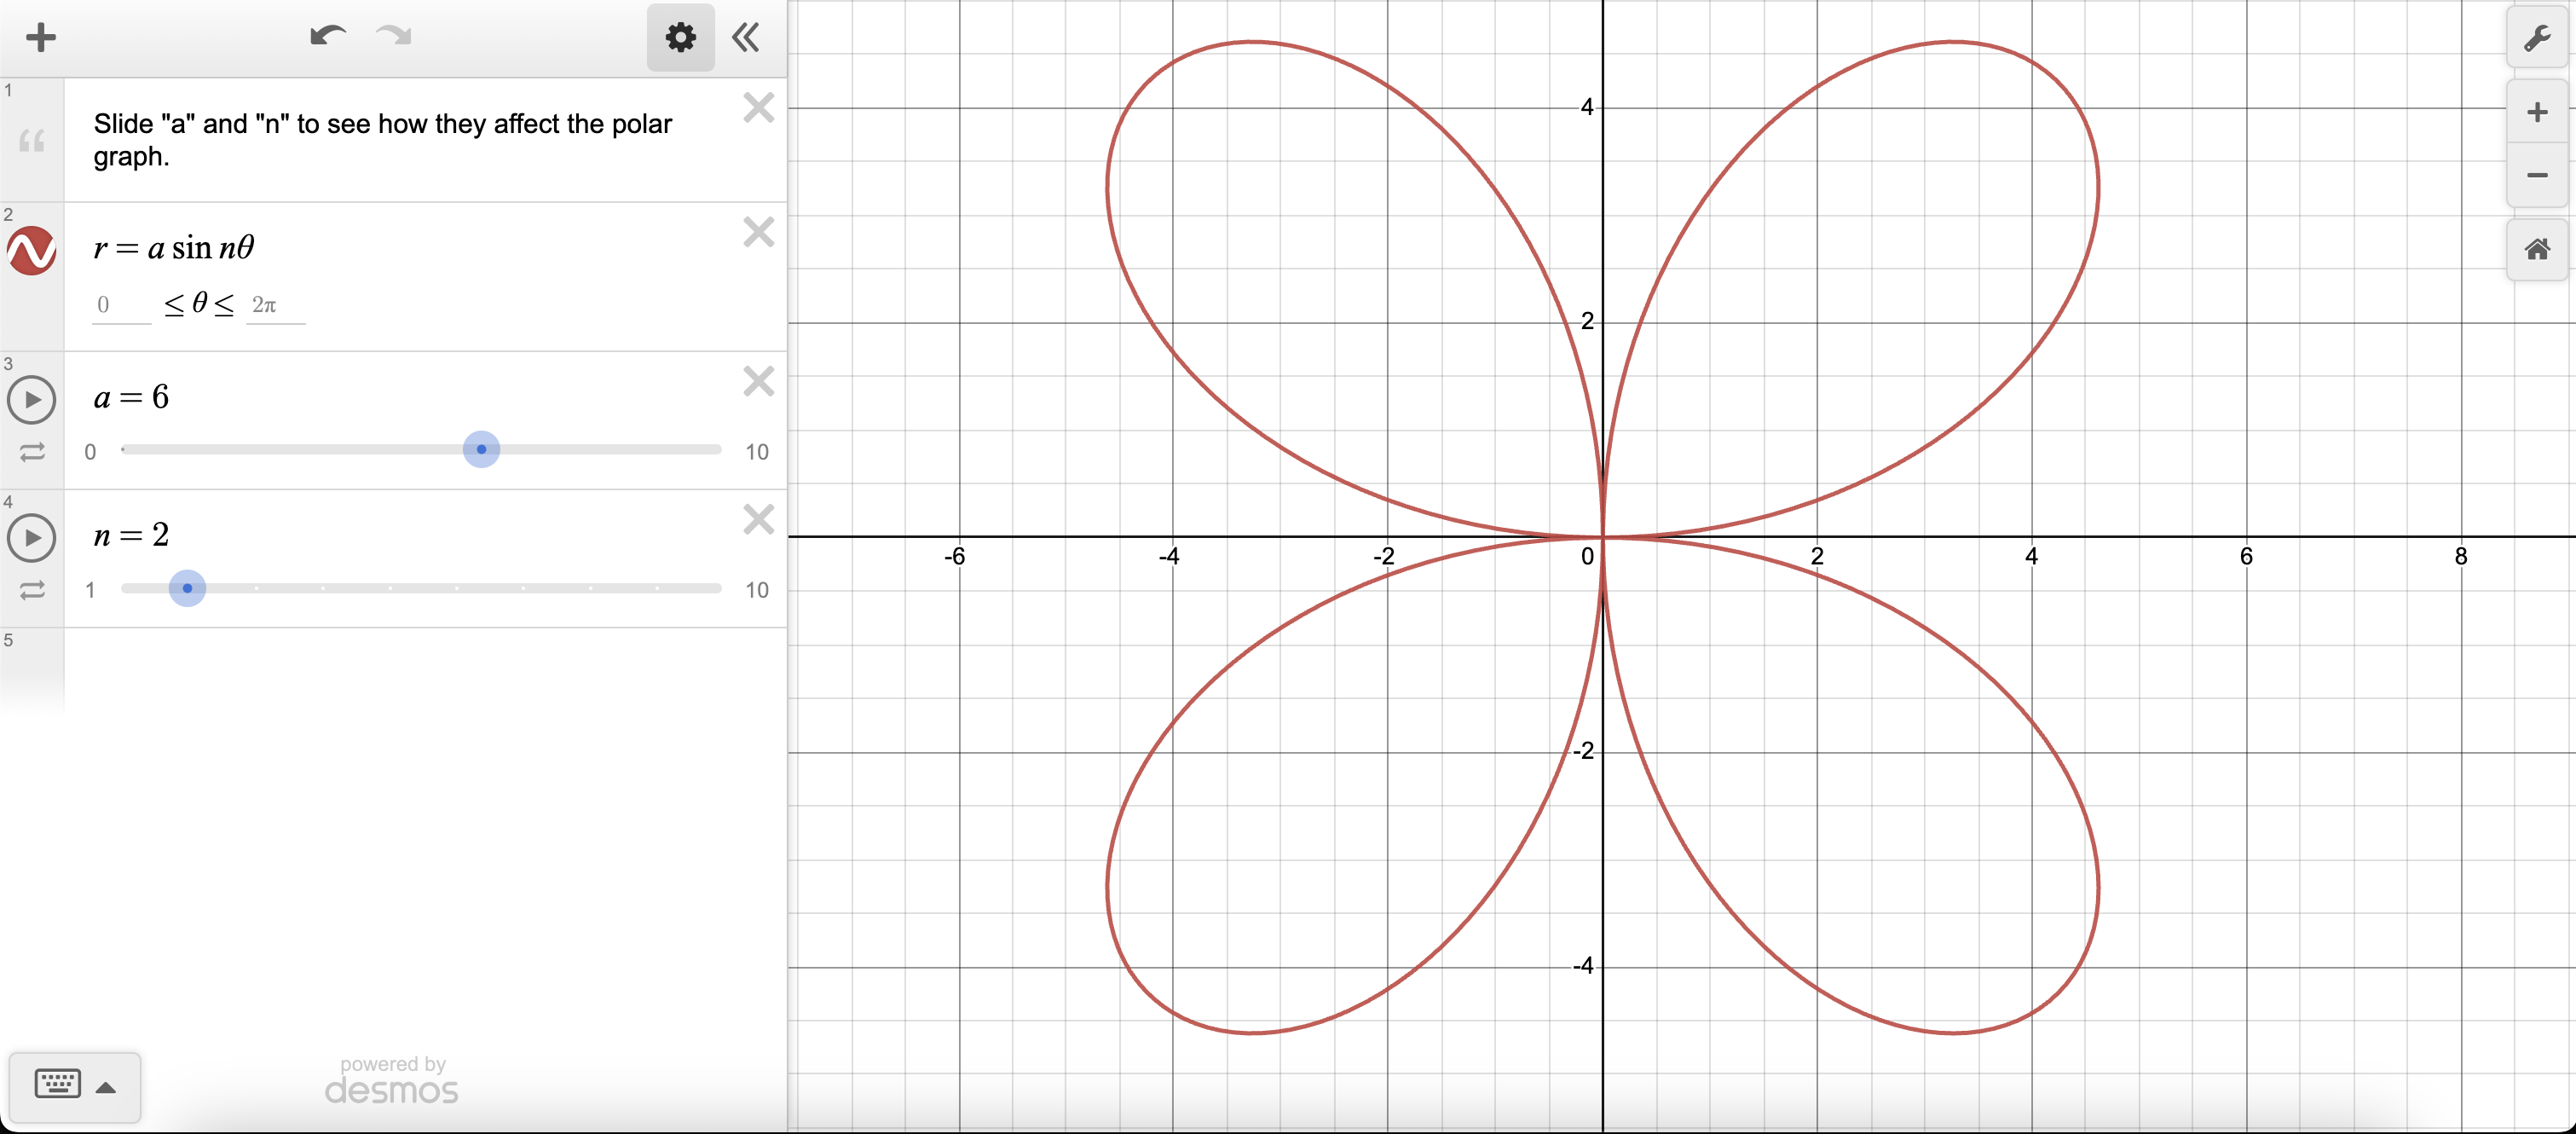
r = a sin n
These graphs are called Rose Curves
If the value of n is an even number then number of “loops” is 2n (Eg: if n is 2 then the number of loops is 4)
If the value of n is an odd number then the number of “loops” is n (Eg: if n is 3 then the number of loops is 3)
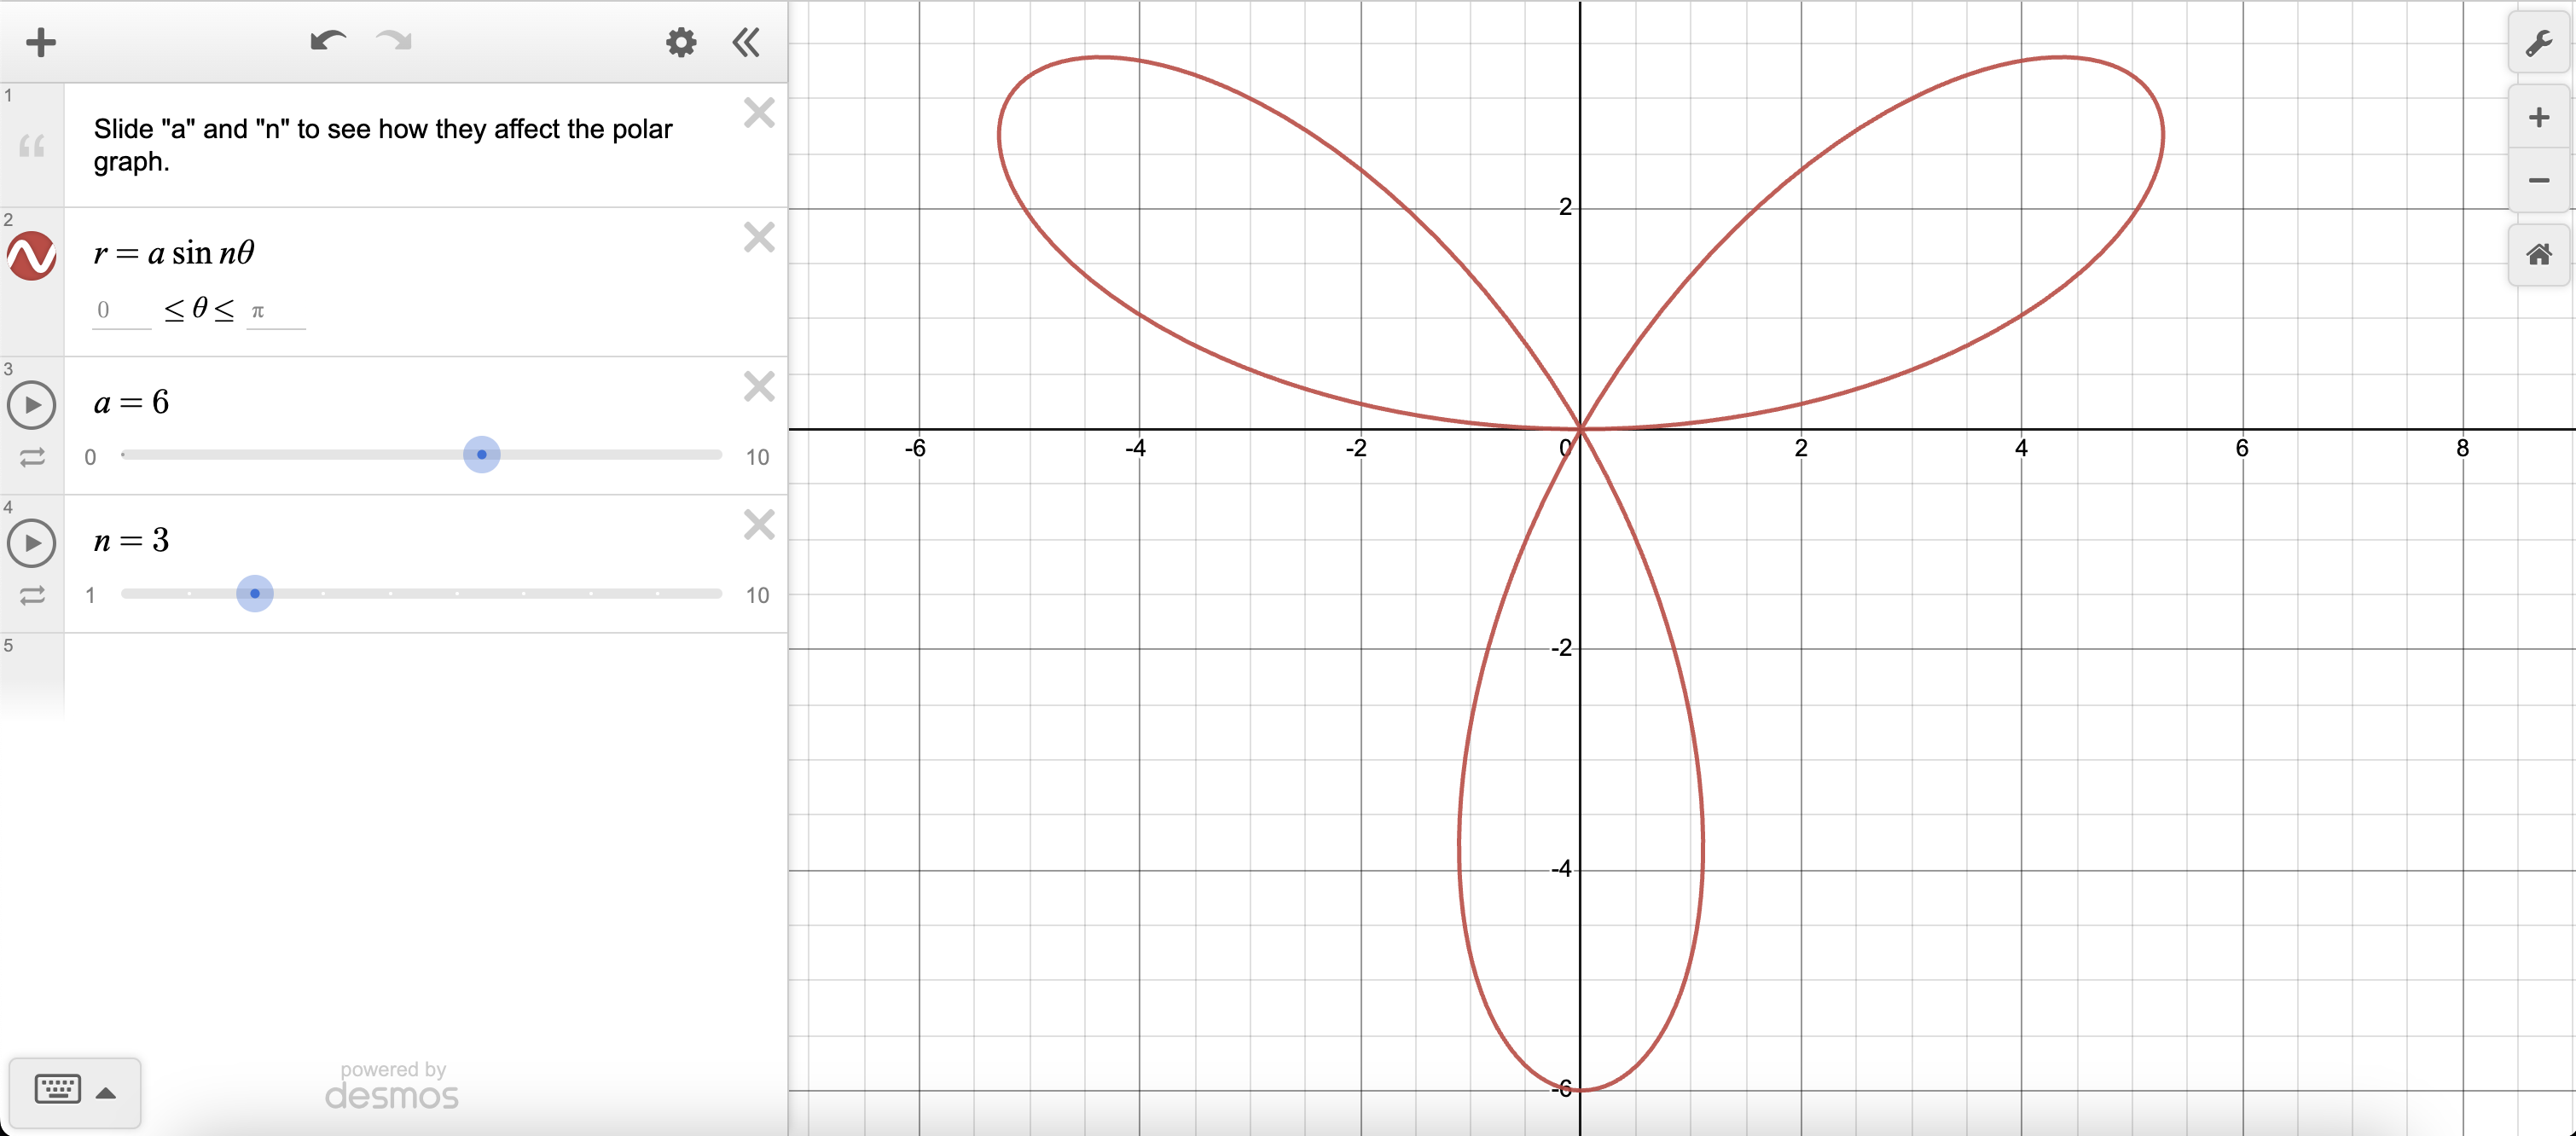
The diameter of each loop = a (doesn’t matter even or odd)
If n = 1 then it’s a normal circle graph
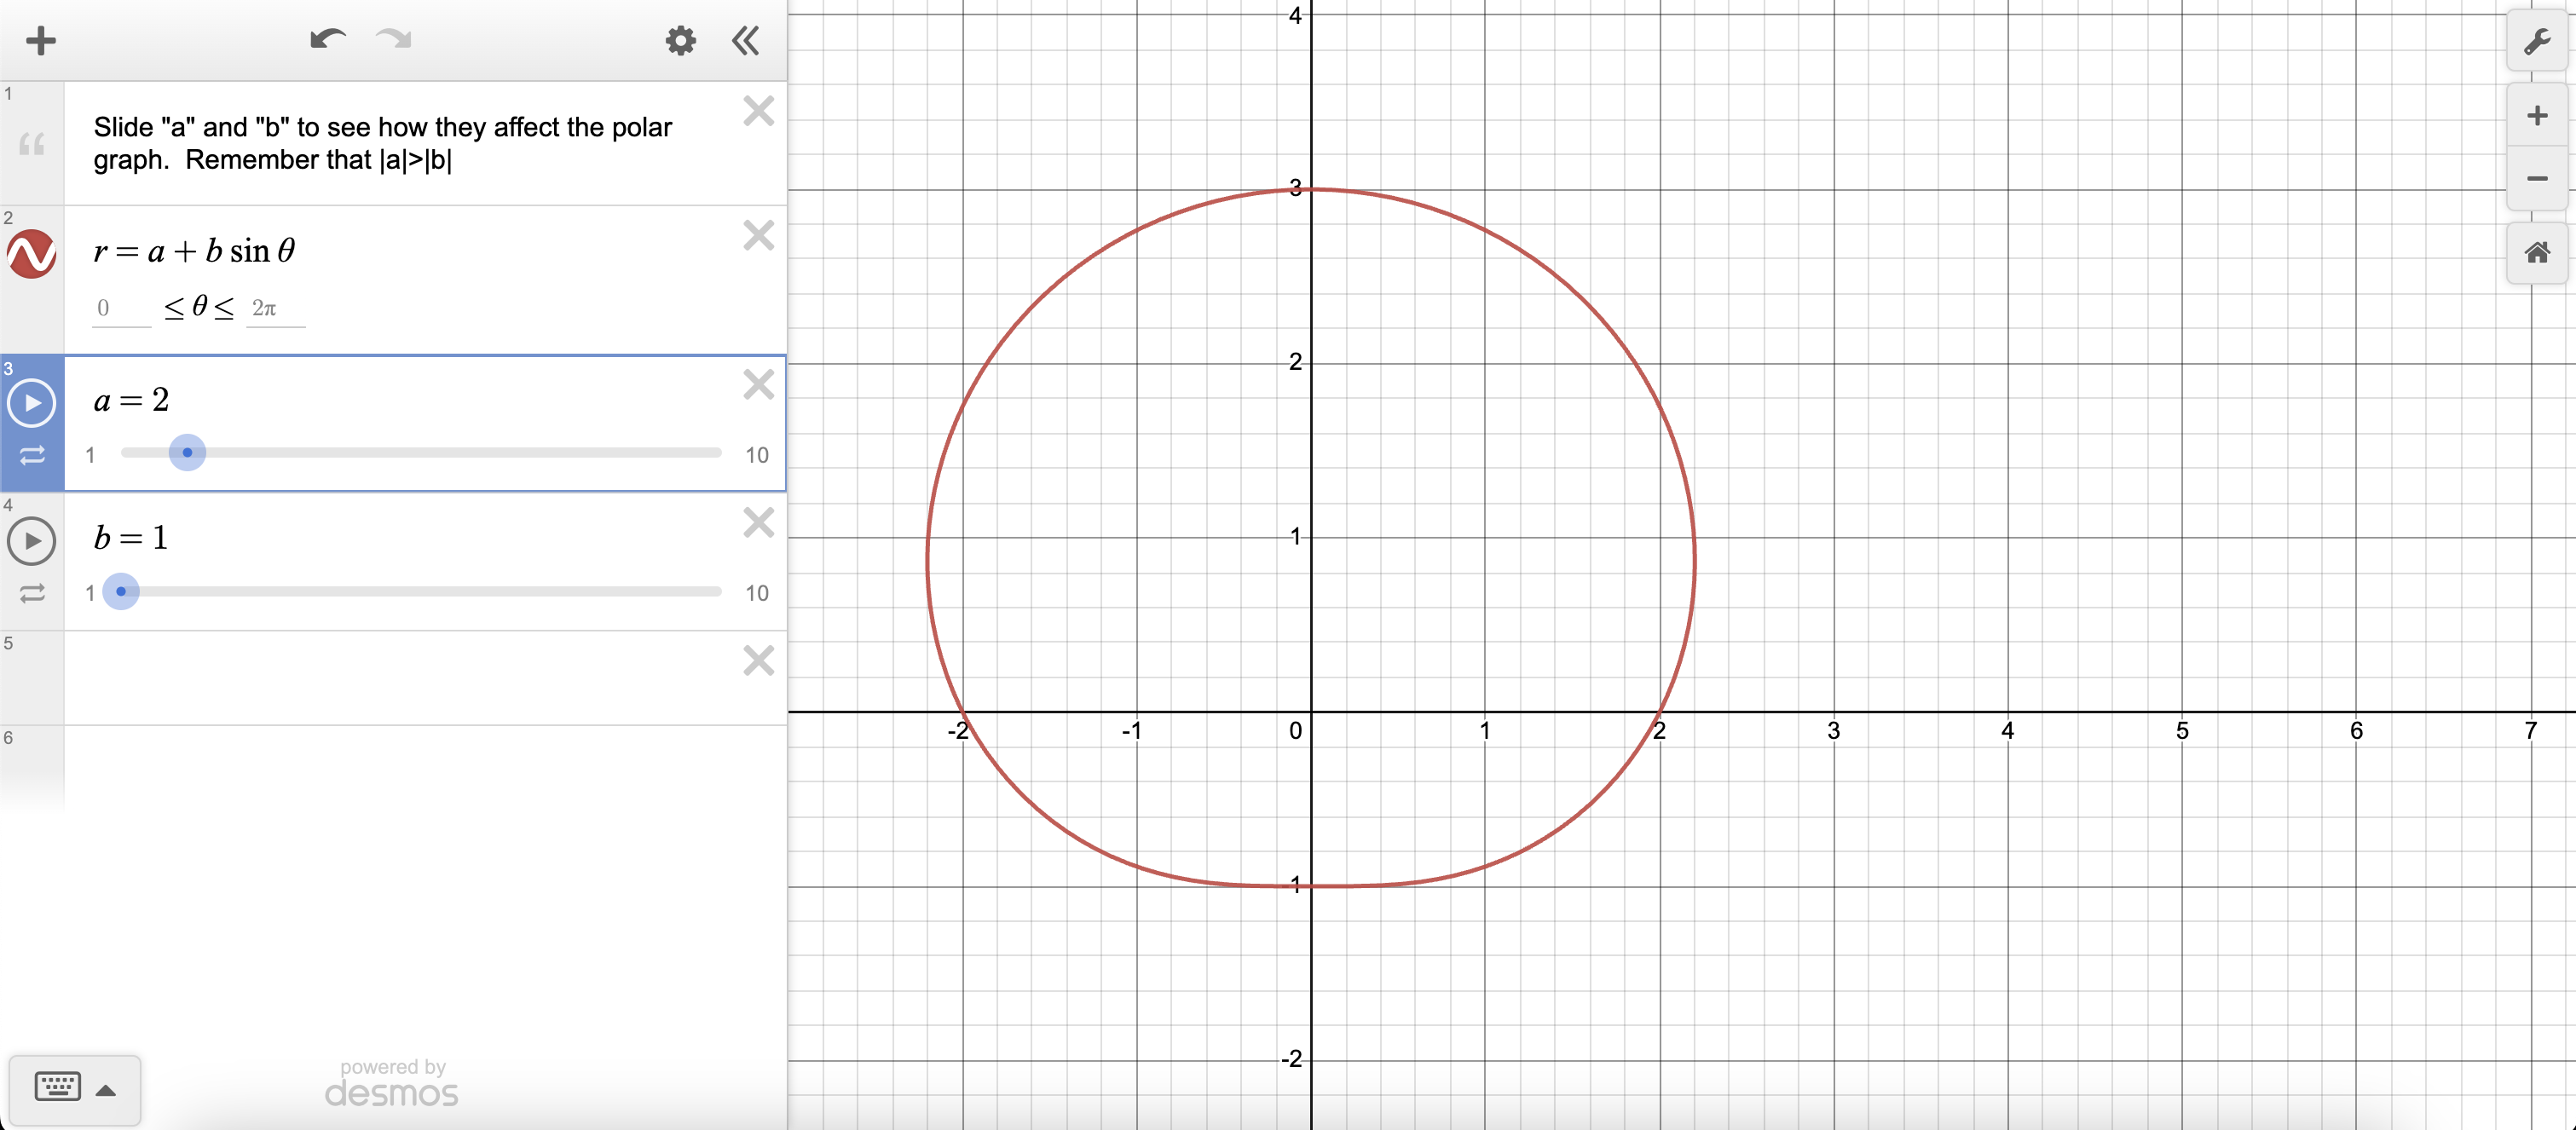
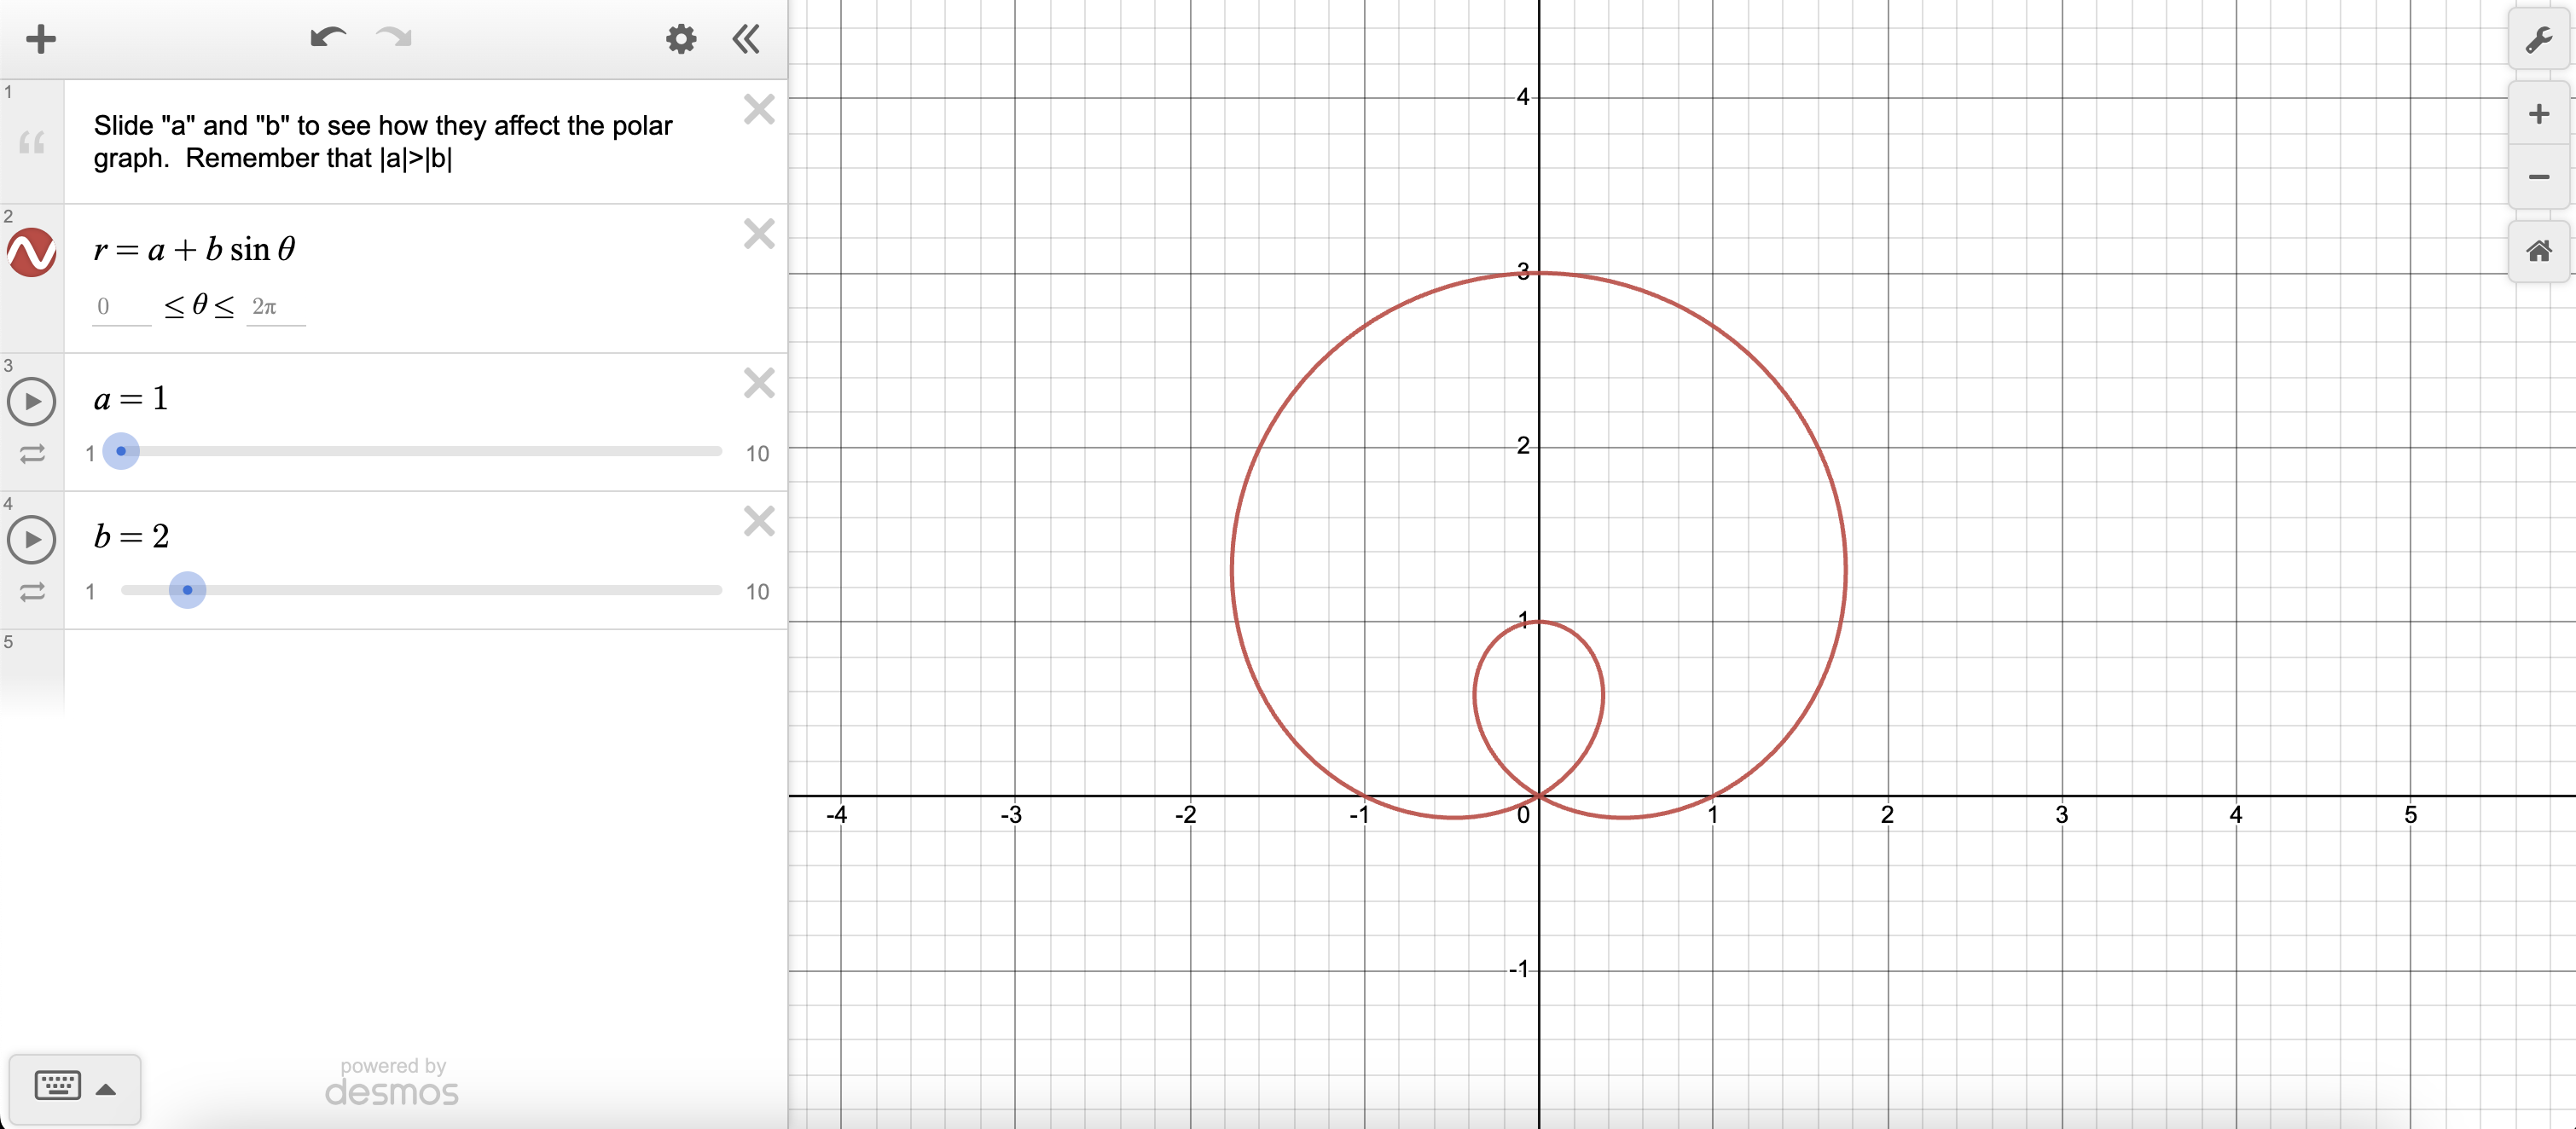
r = a + b sin
These graphs are also called limaçons
if a > b then the graph makes a weird shape, not exactly a circle
if b > a then the graph makes a weird inner loop, (amongus character?)
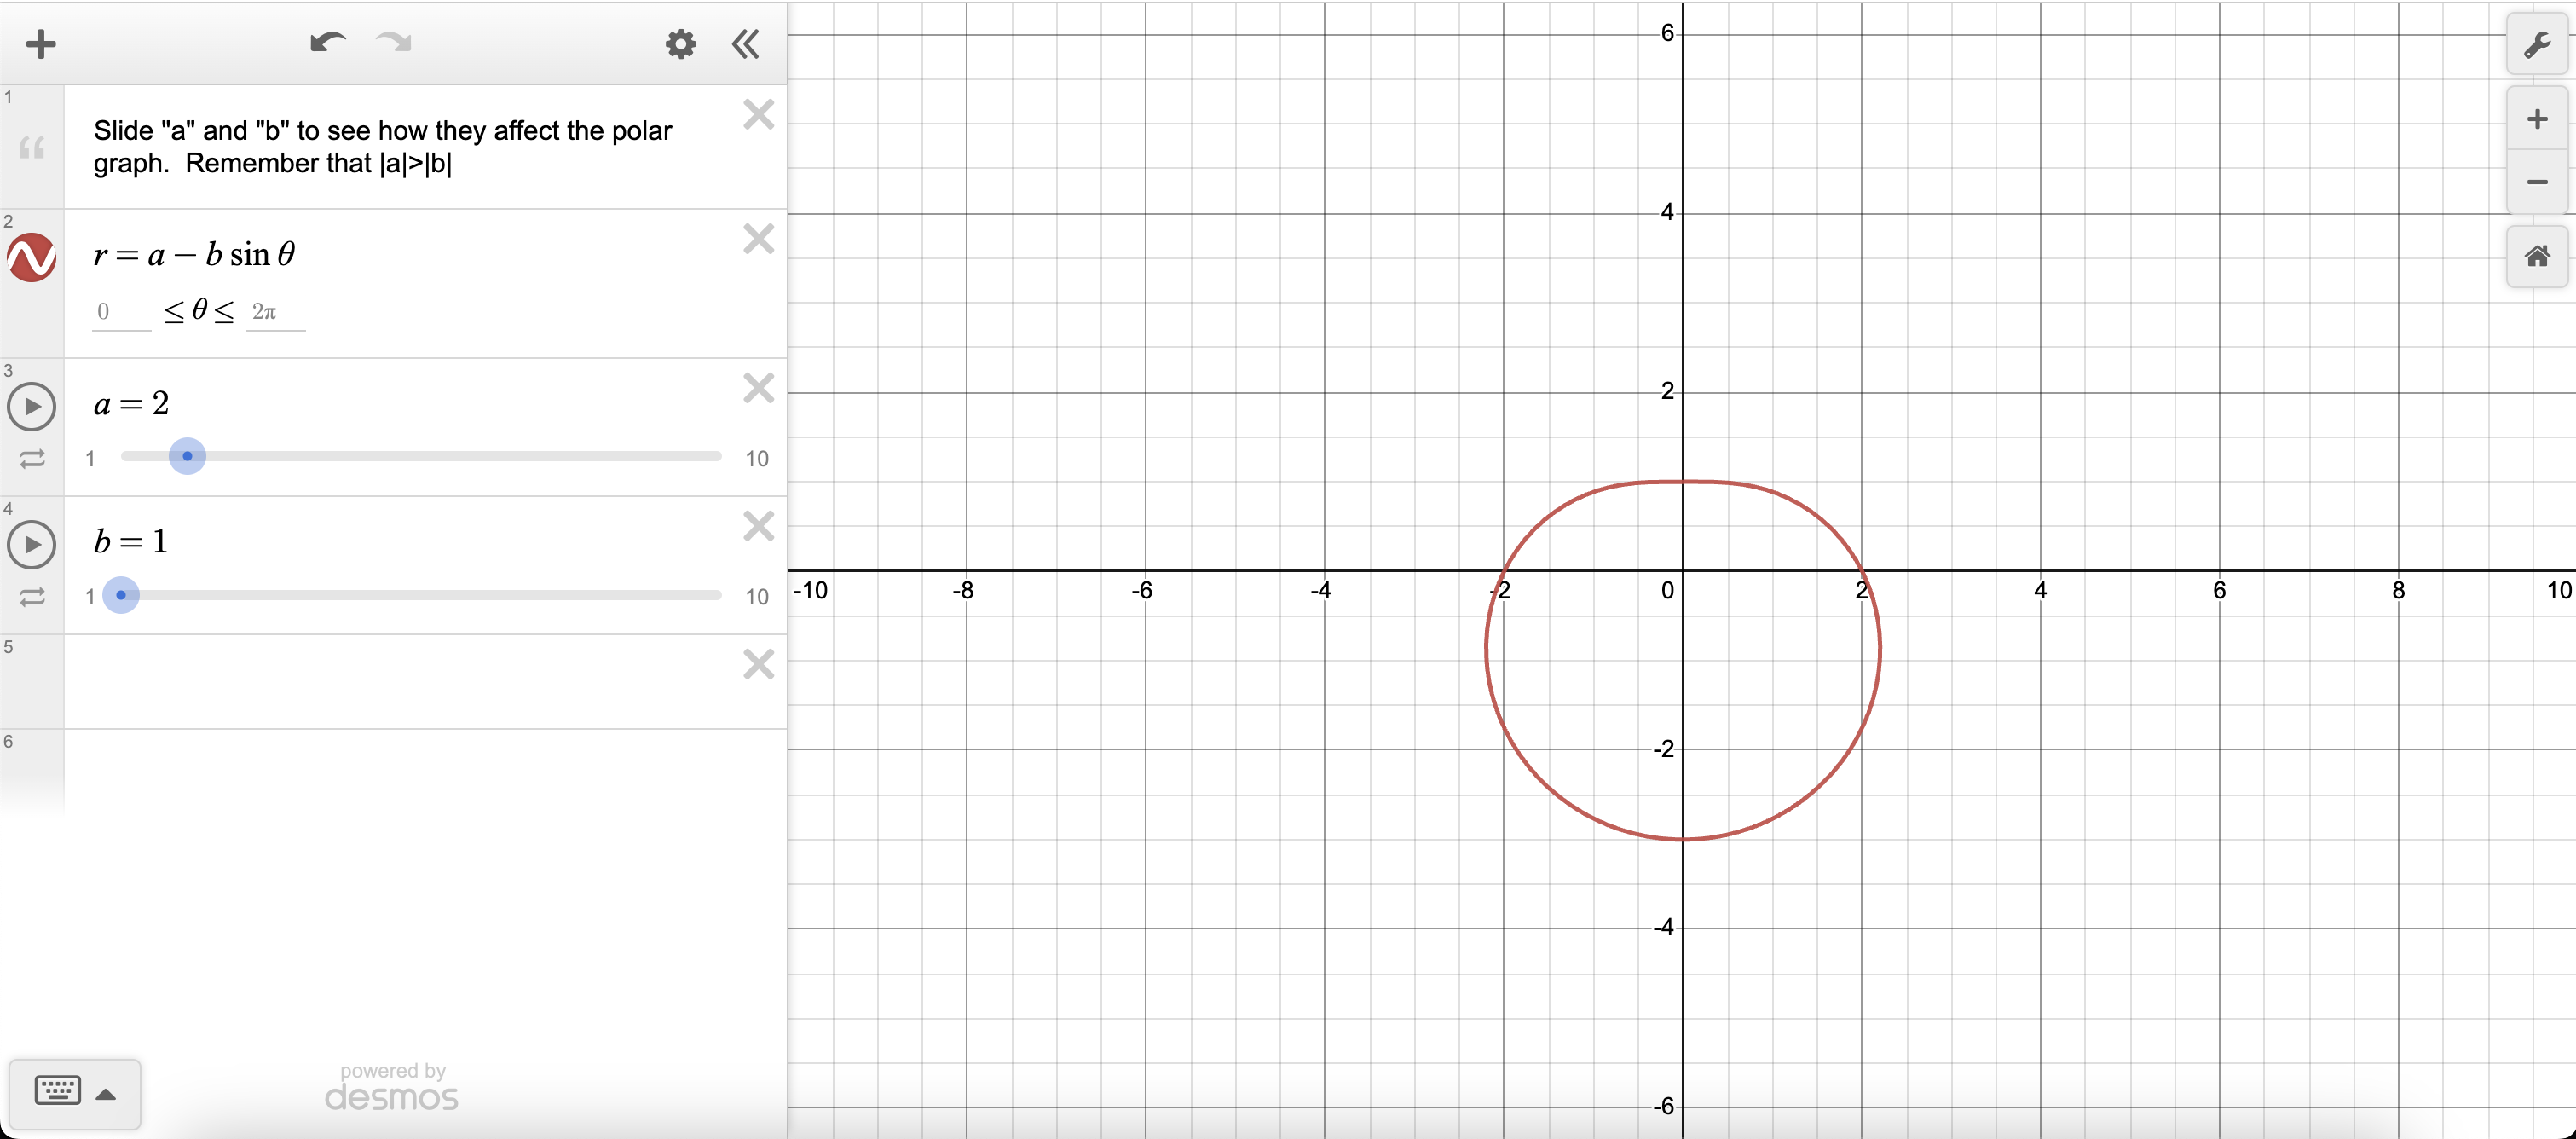
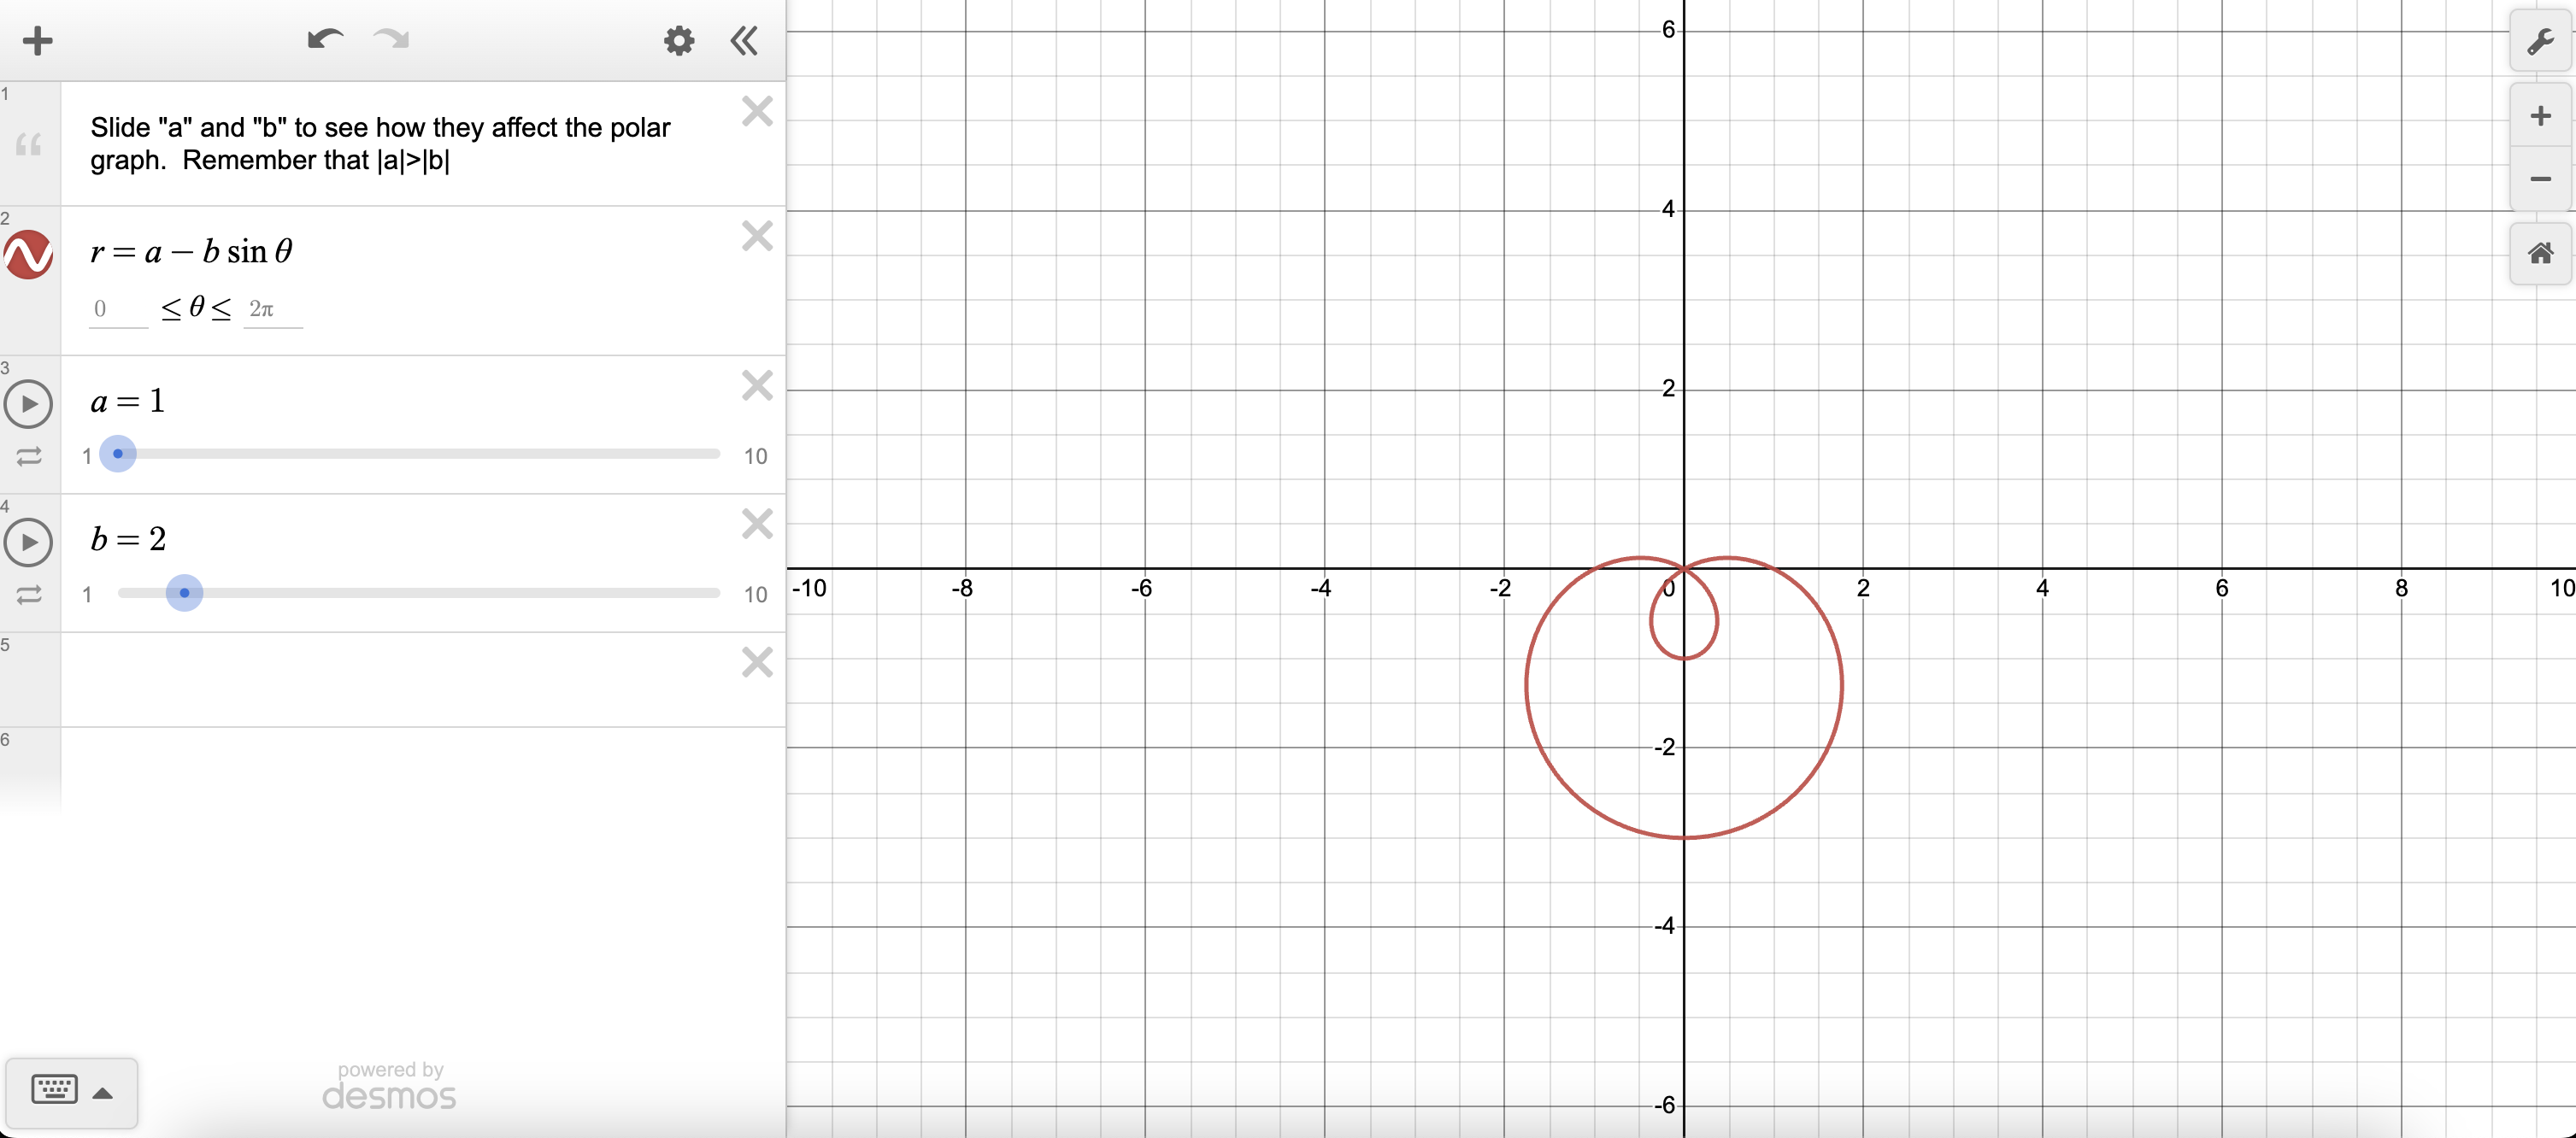
r = a - b sin
These graphs are also called limaçons
if a > b then the weird line goes on the top
if a < b then the loop in the other figure goes on the top
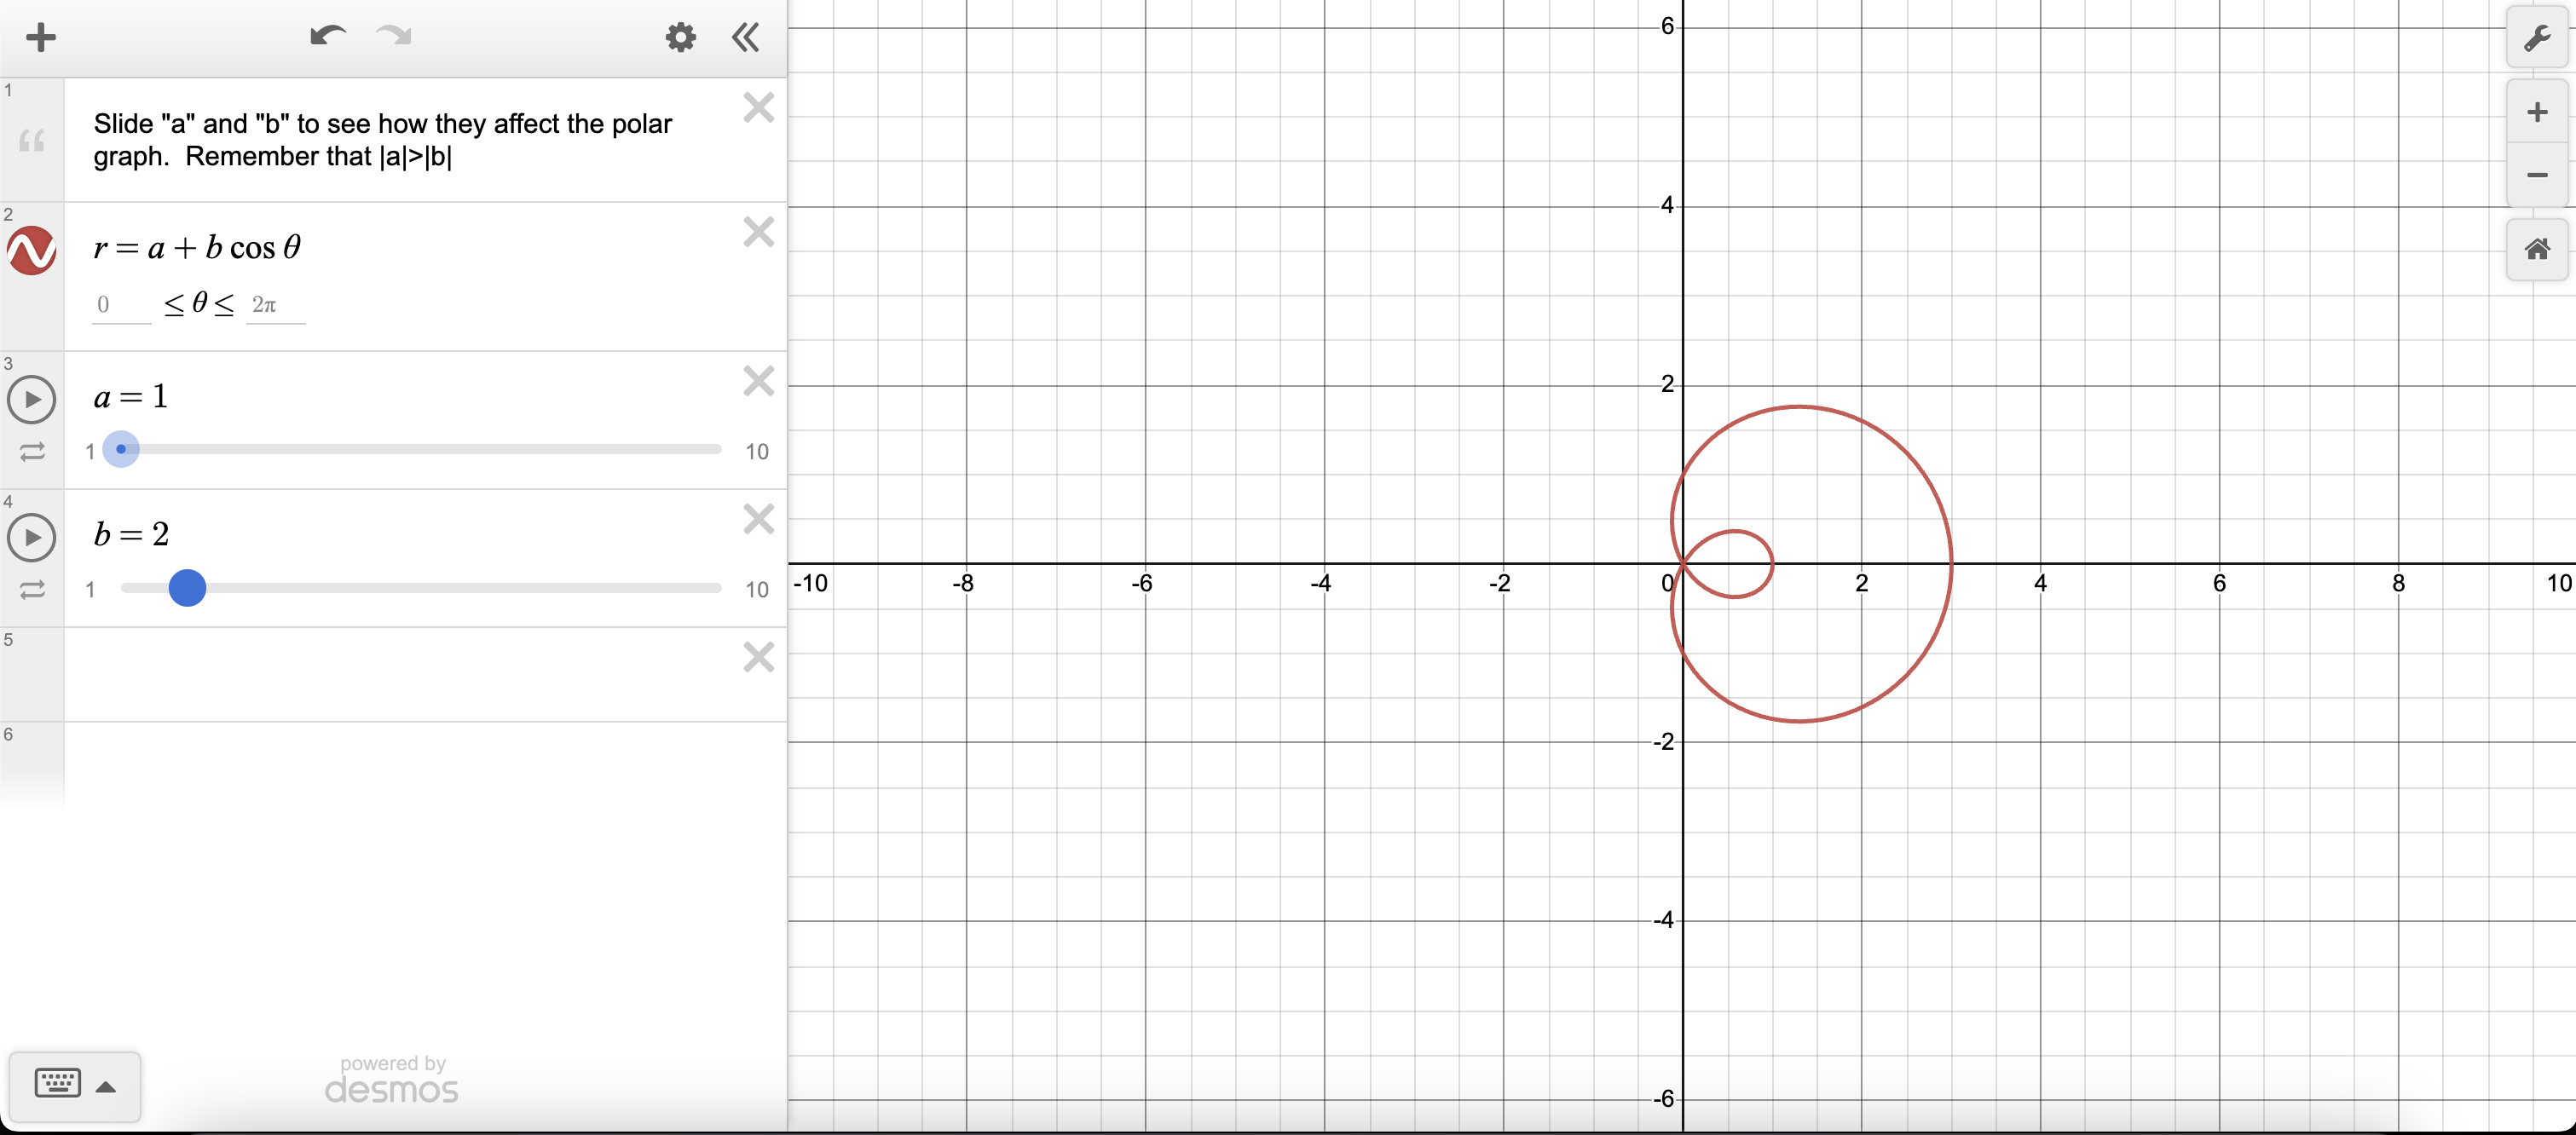
r = a + b cos
These graphs are also called limaçons
if a > b then the weird line goes on the left
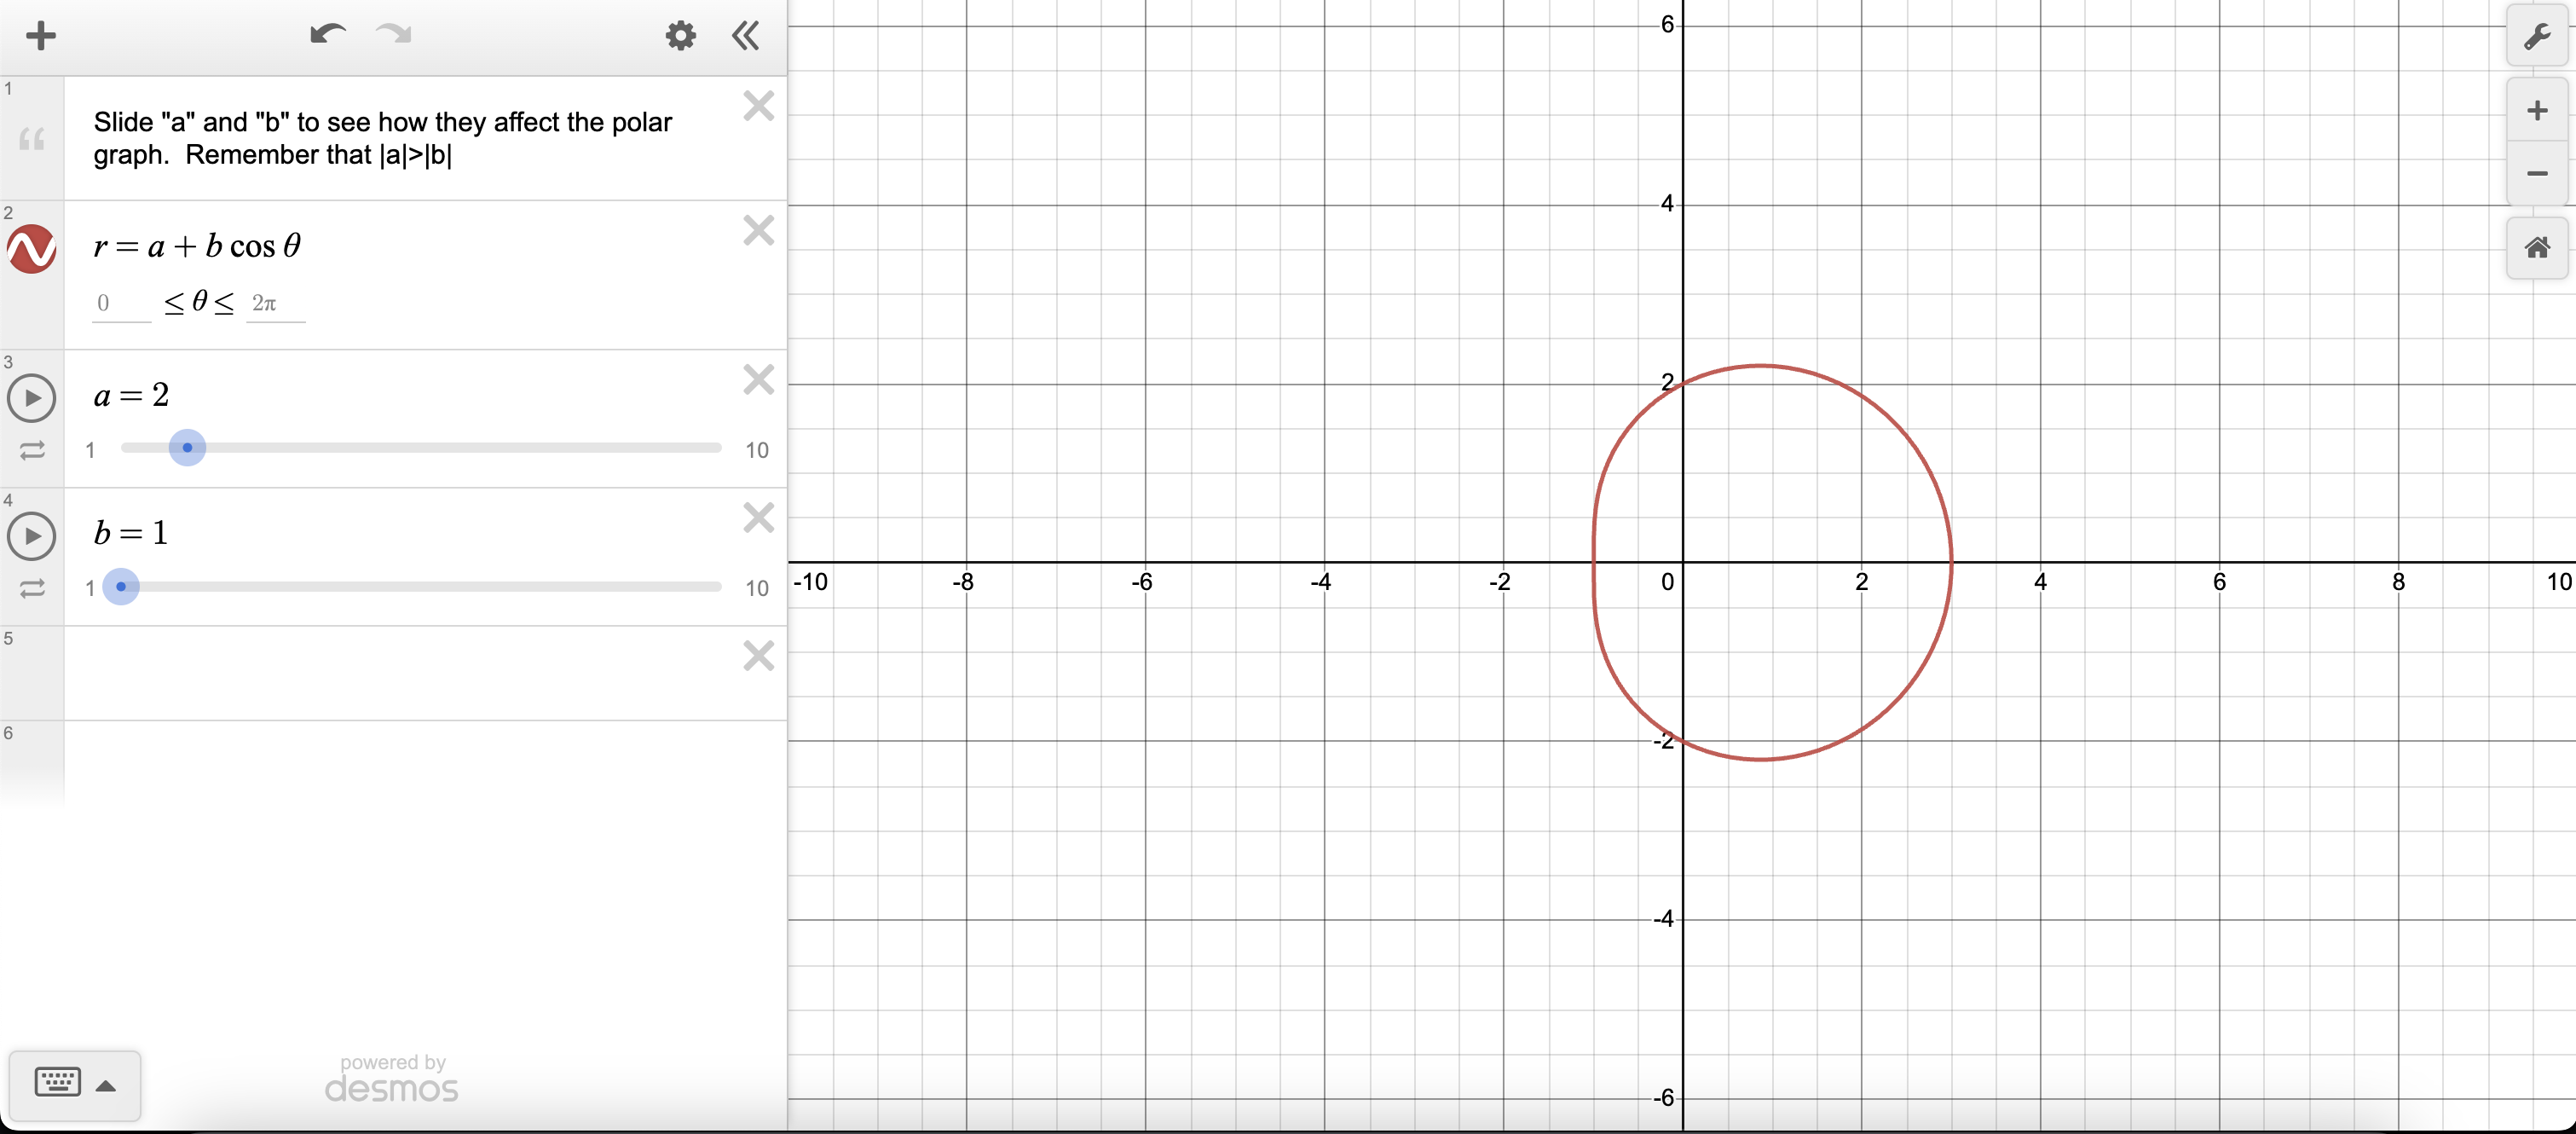
if a < b then the weird loop goes on the left
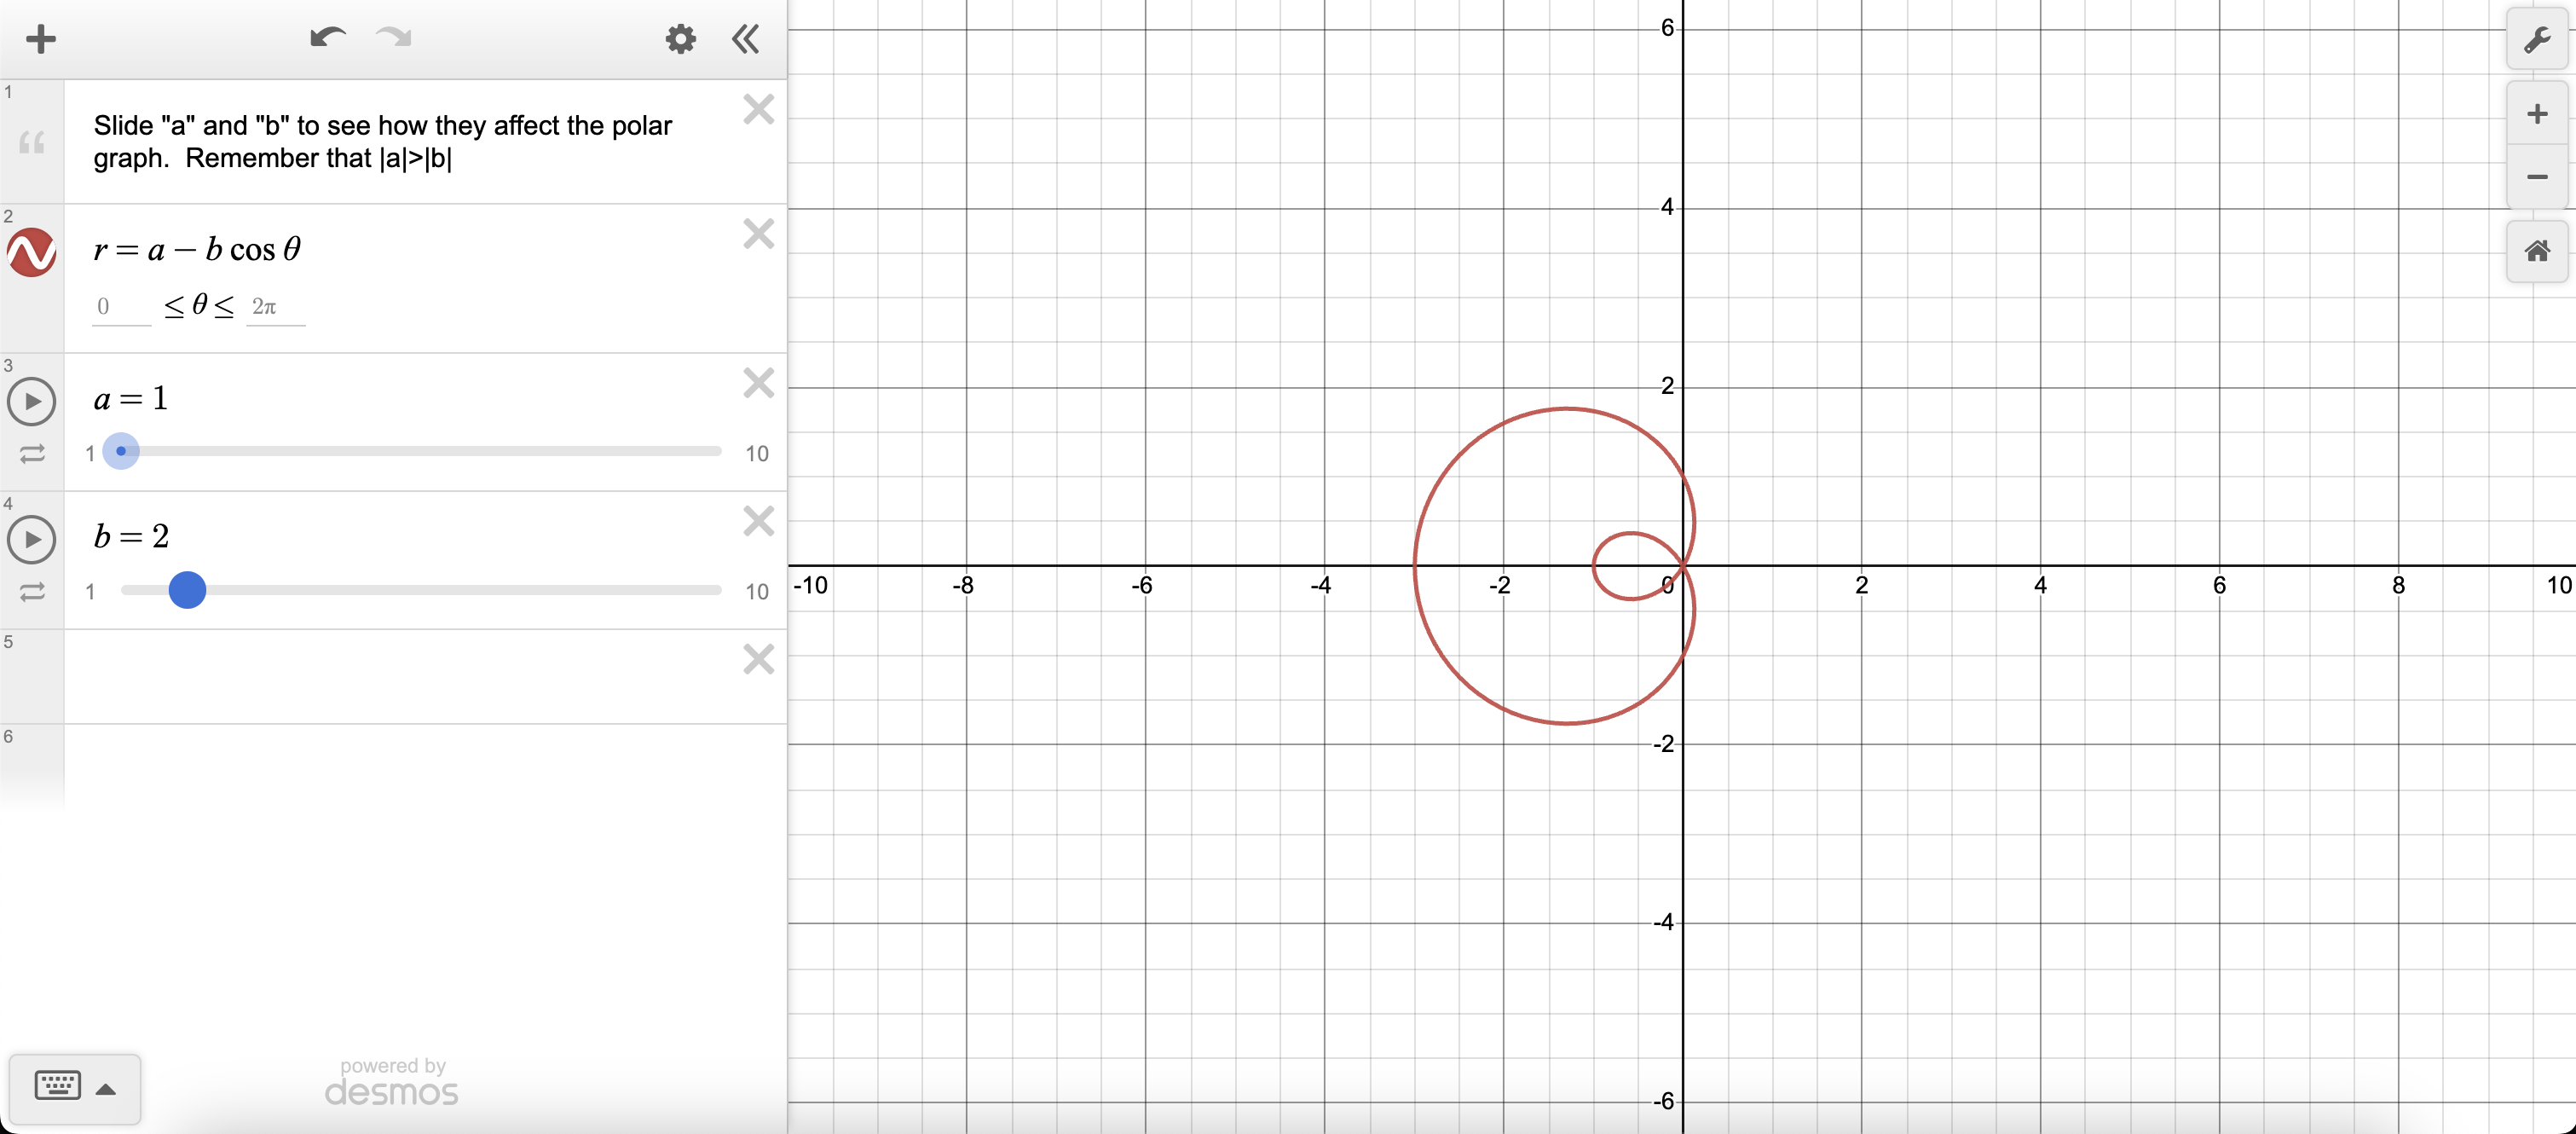
r = a - b cos
These graphs are also called limaçons
if a > b then the weird line goes on the right
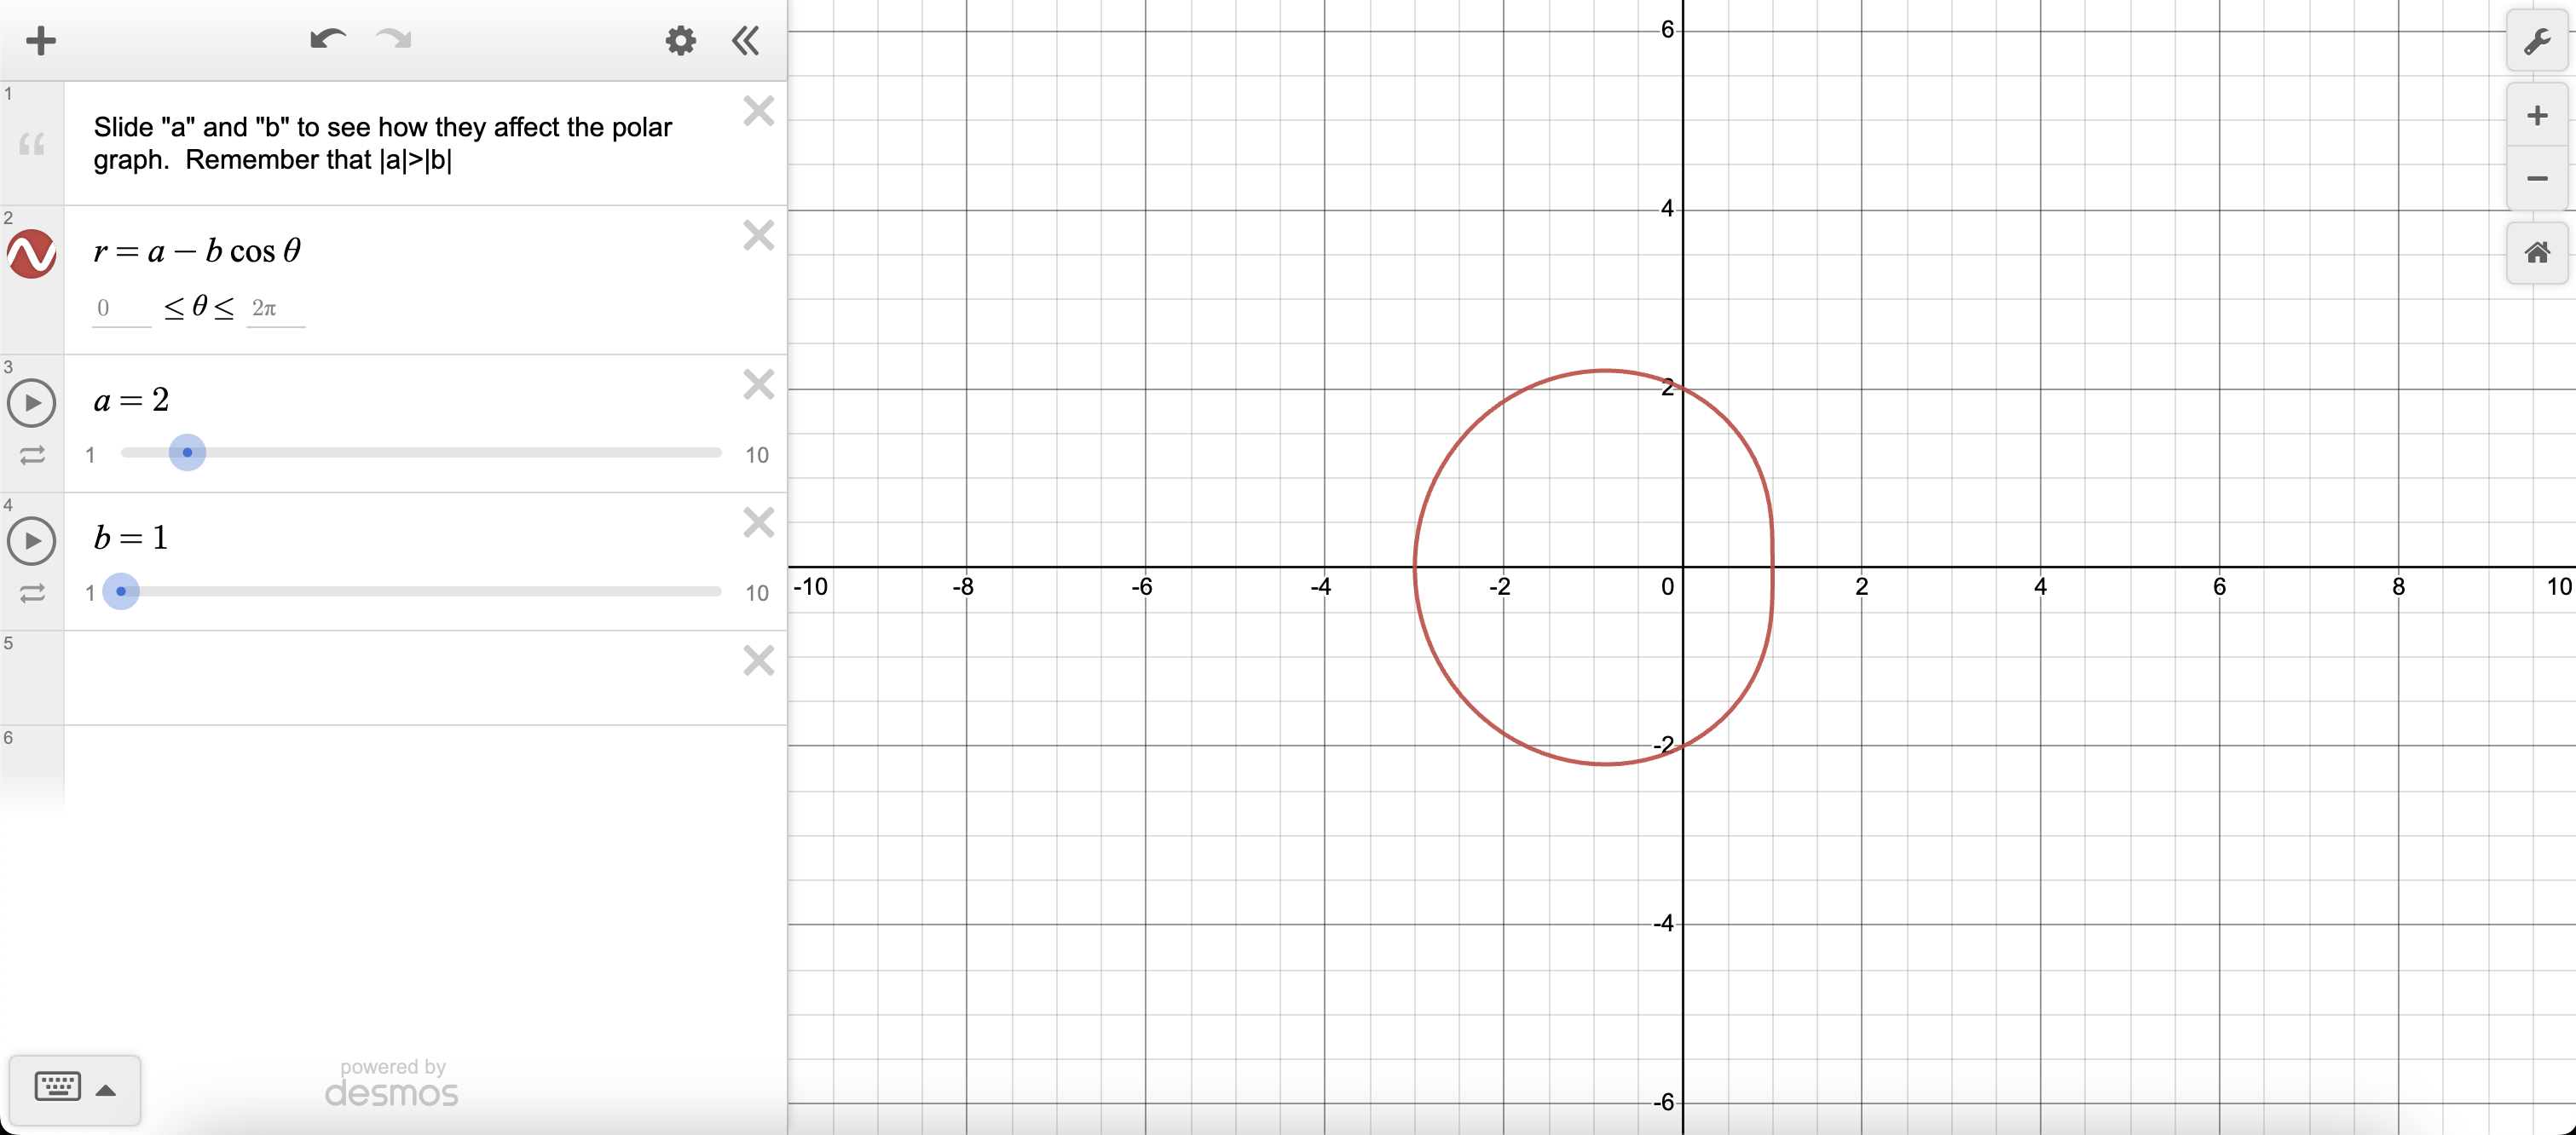
if a < b then the weird loop goes on the right
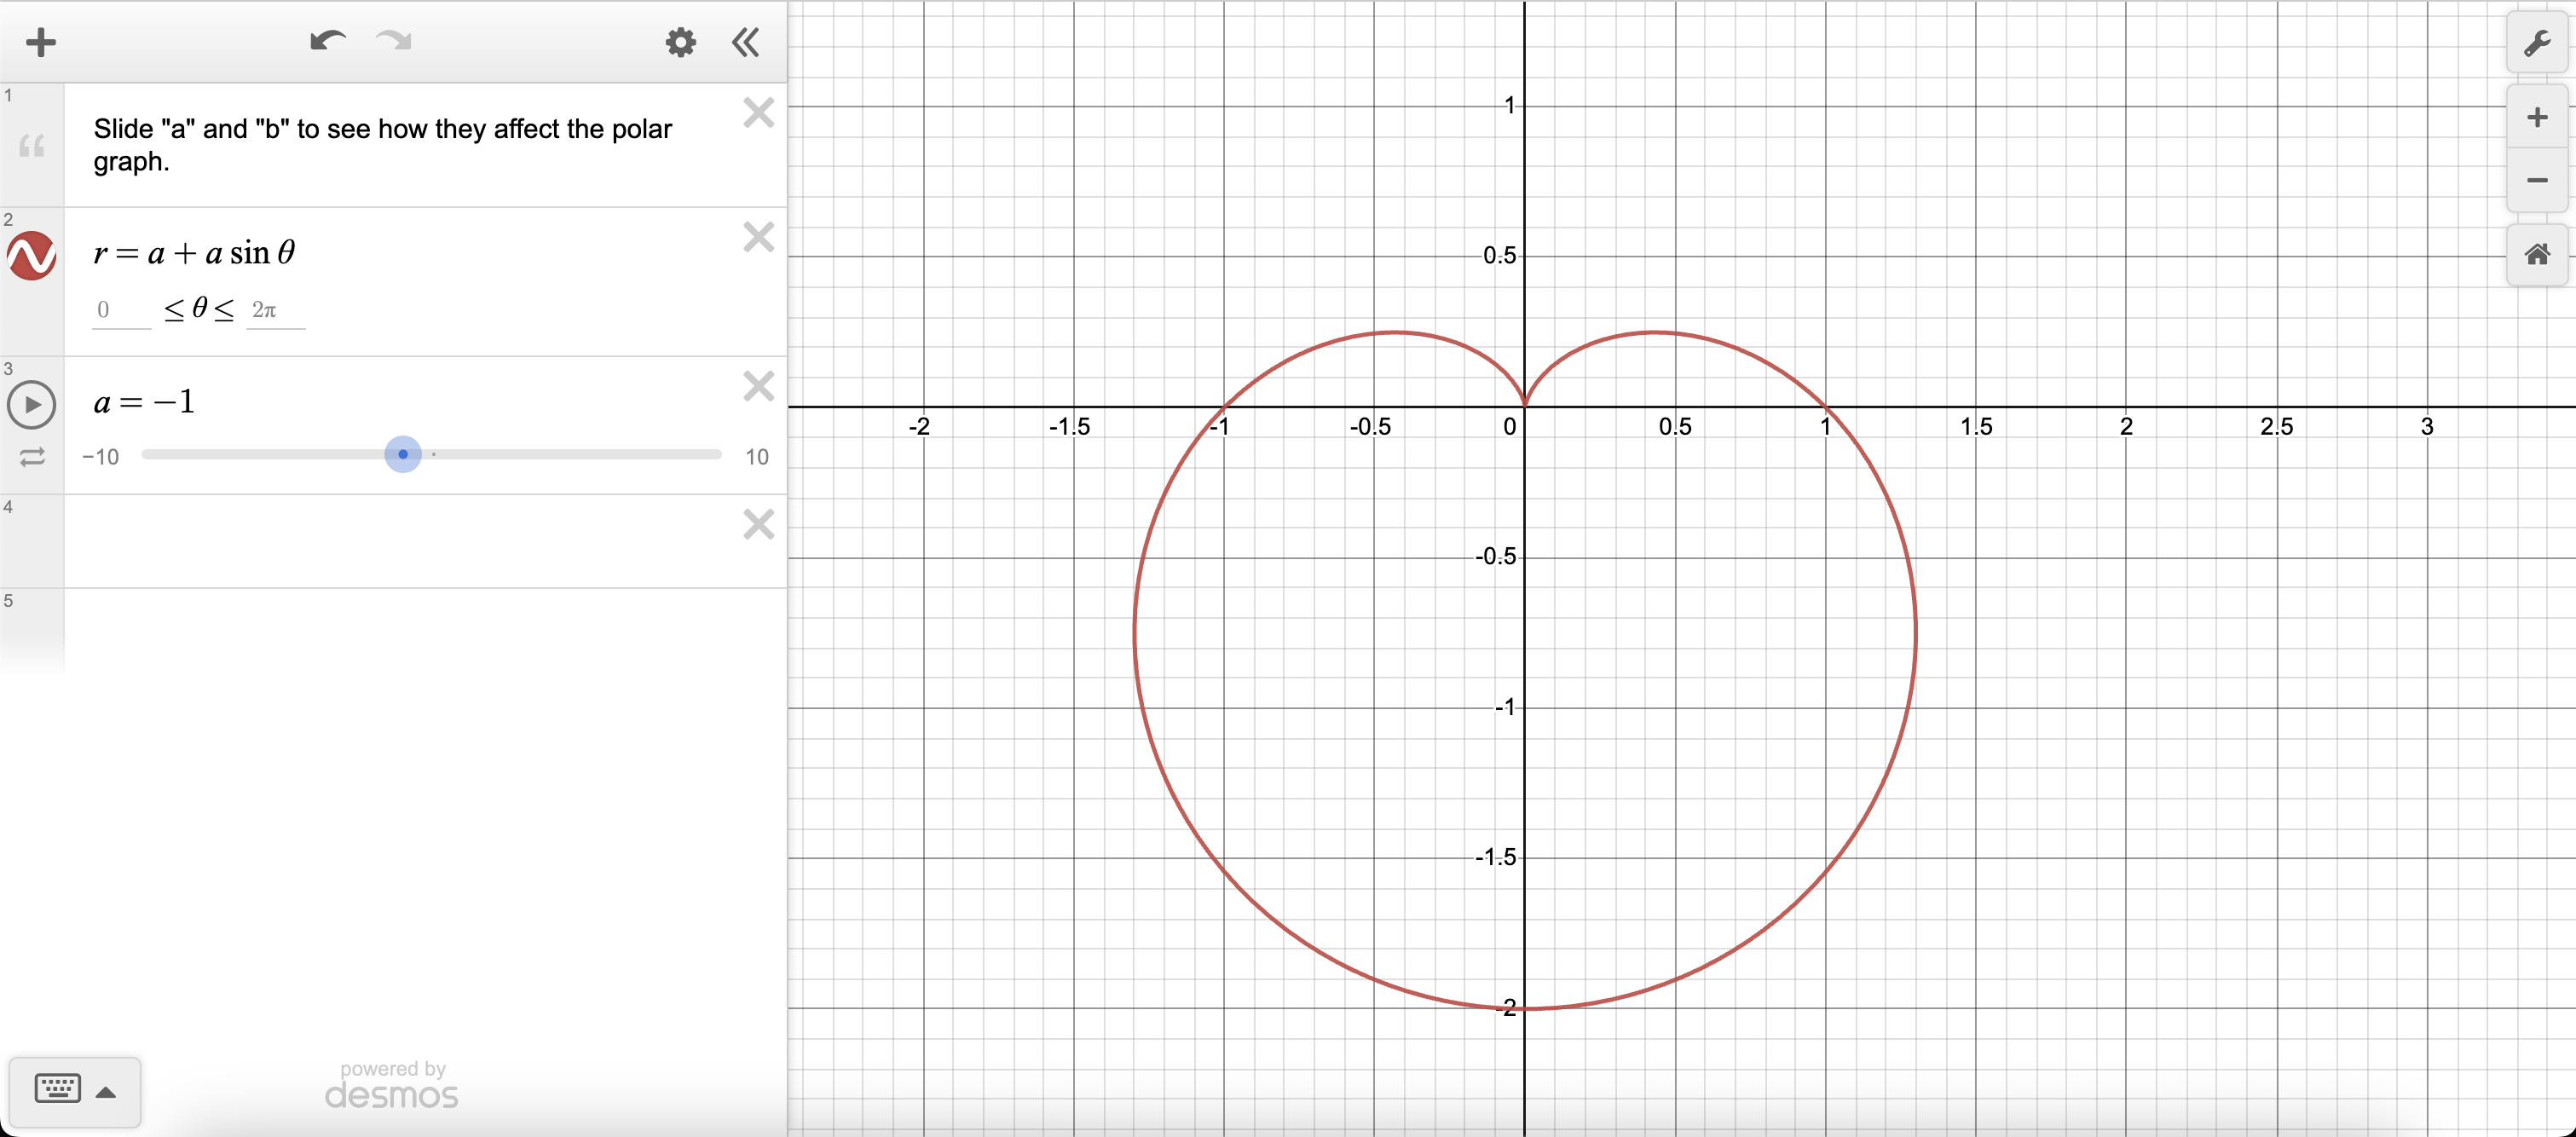
r = a + a sin
Graphs are called cardiods
if a > 0 then we get this shape that’s upwards
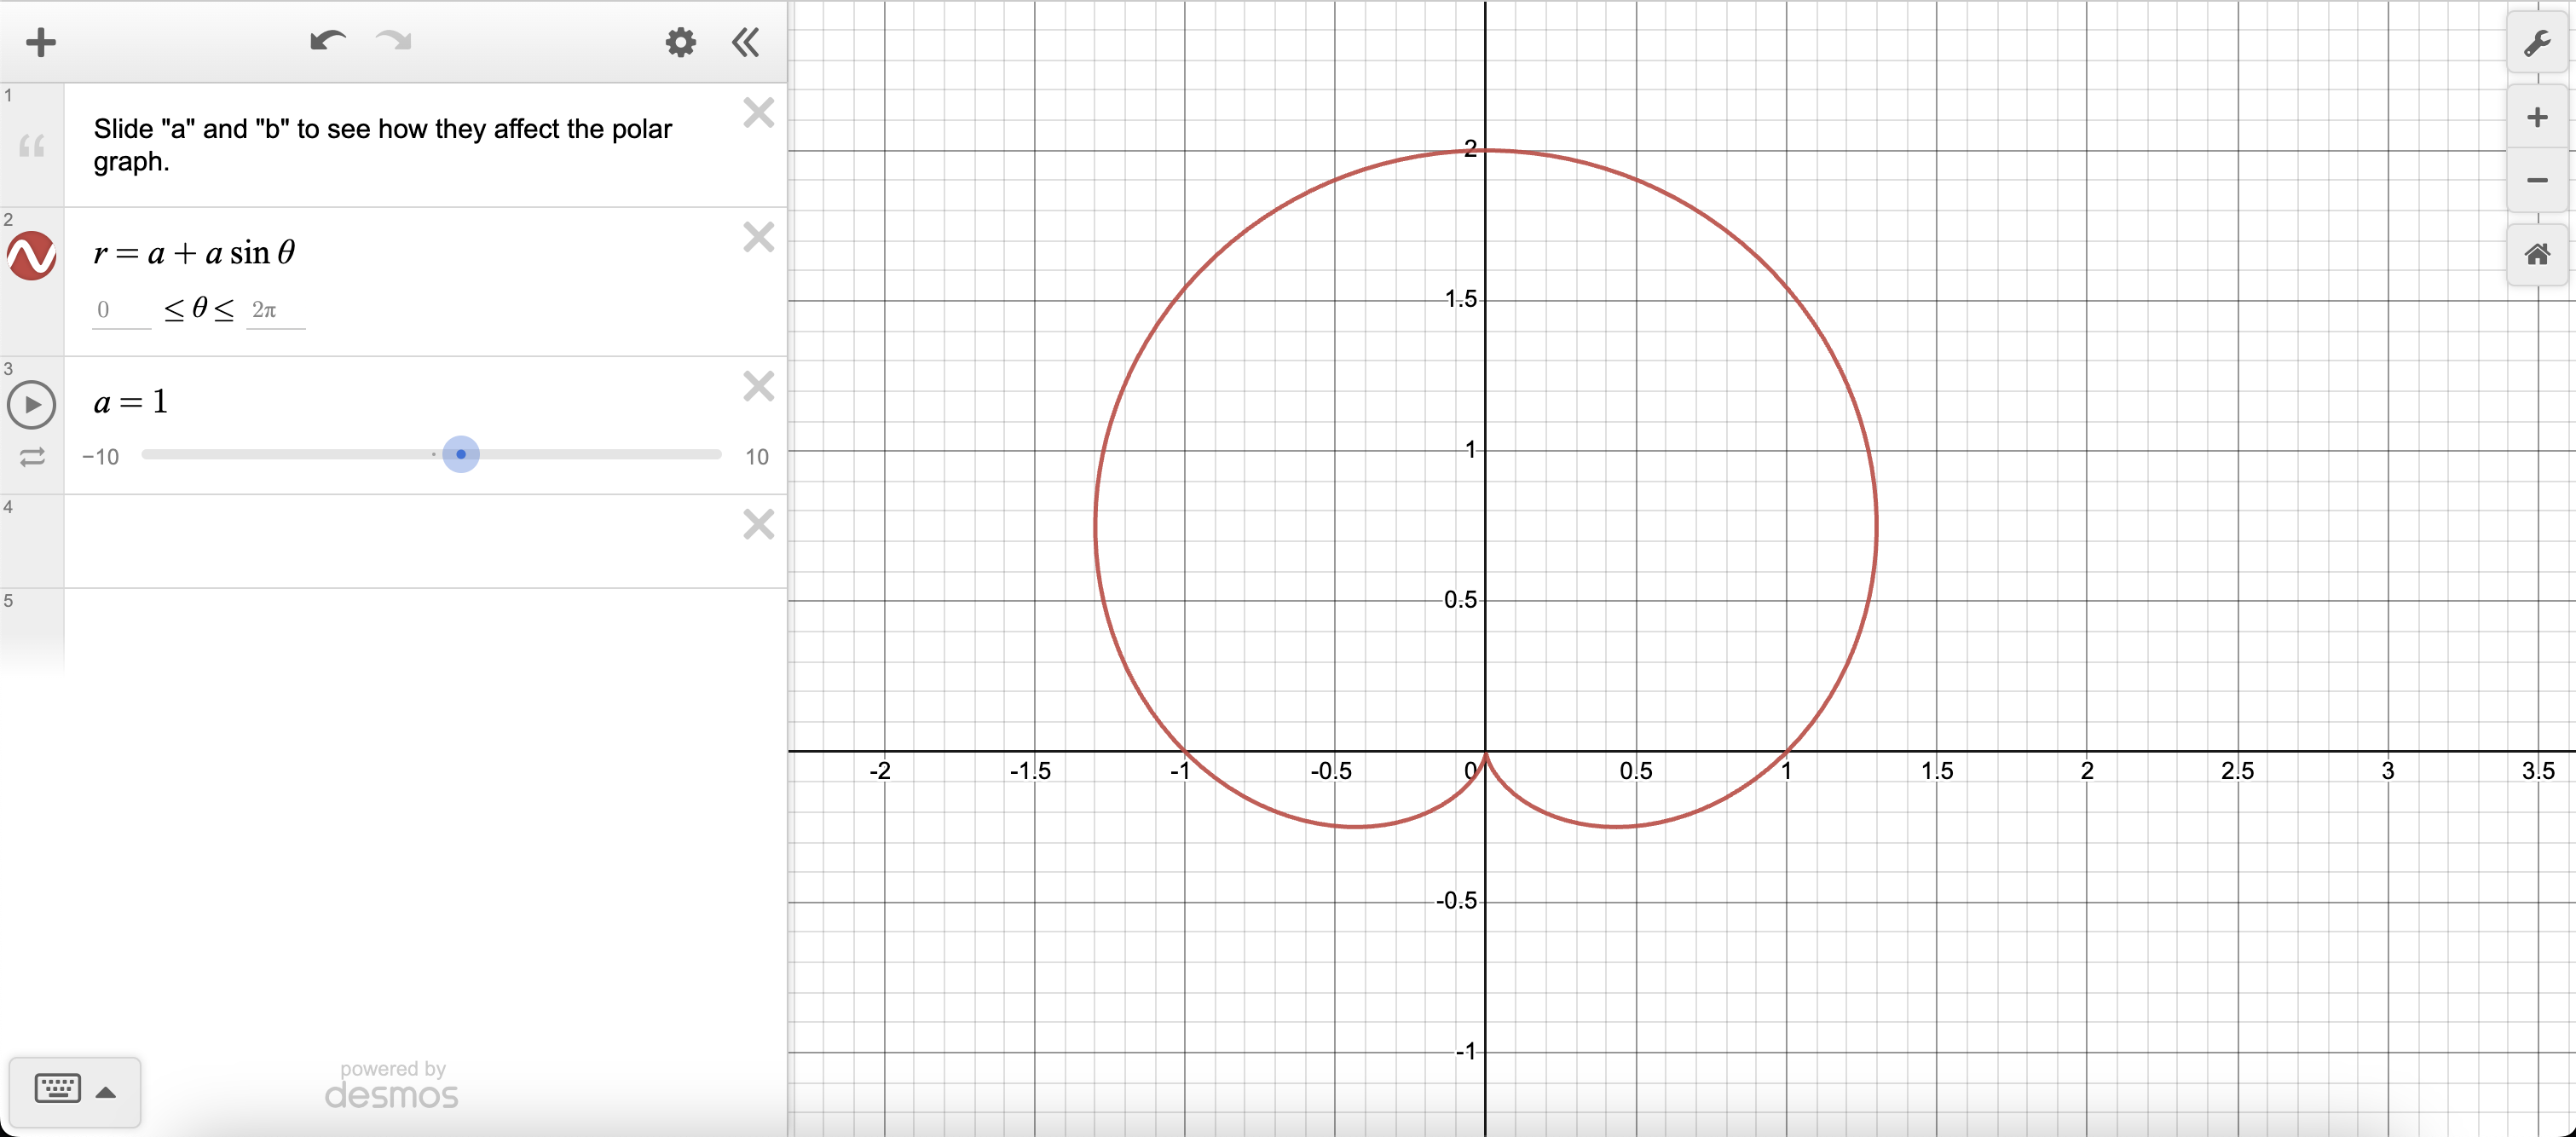
if a < 0 then we get this shape that’s downwards
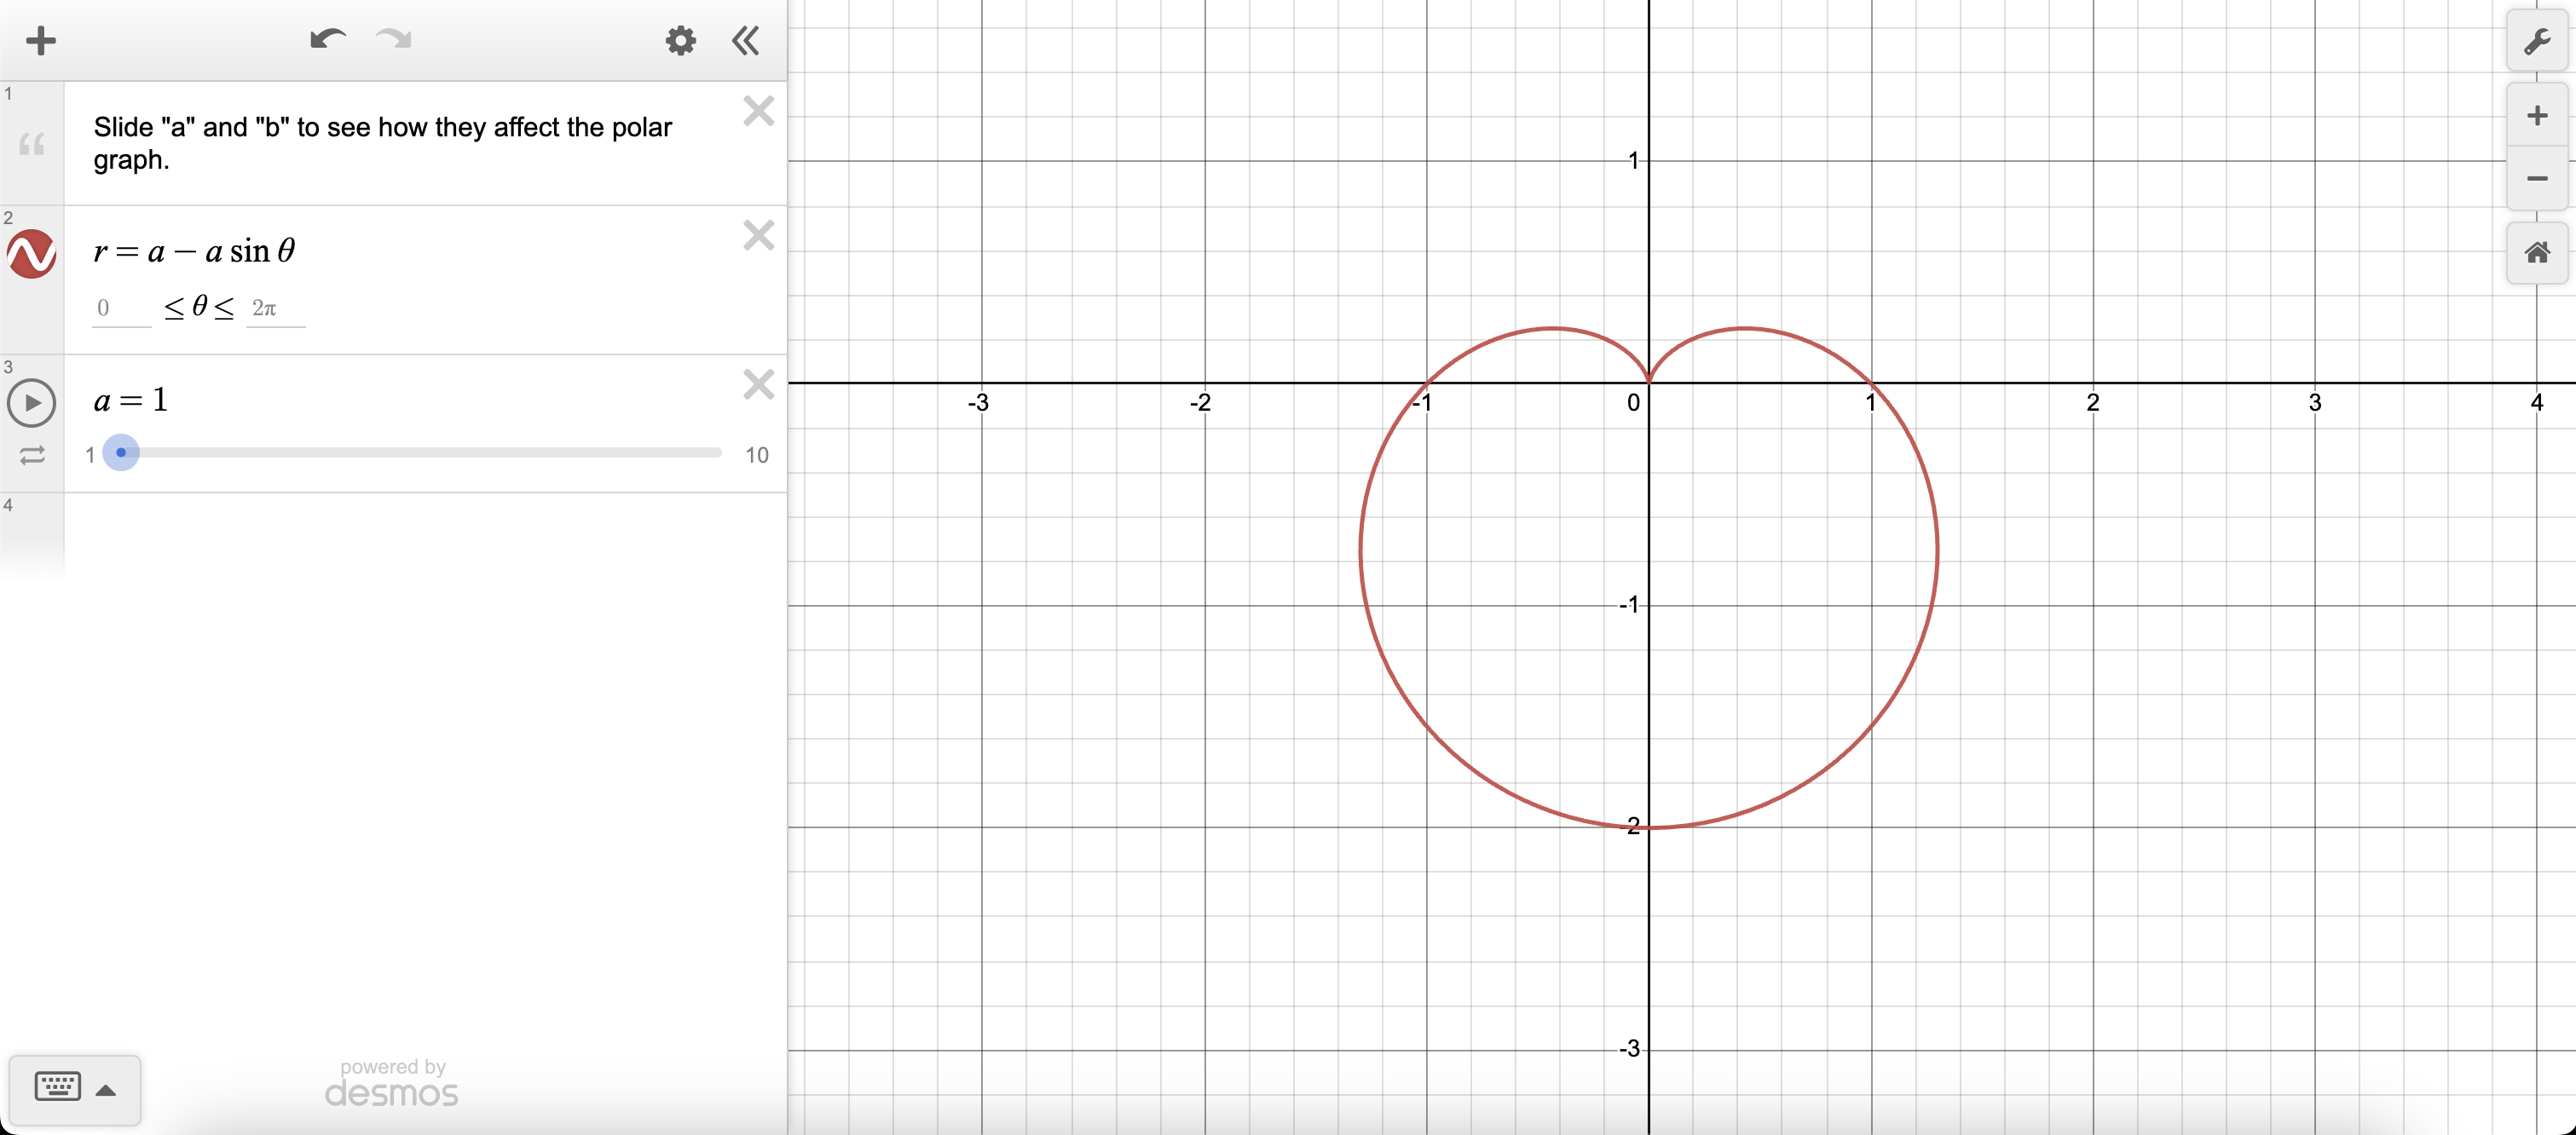
r = a - a sin
Graphs are called cardiods
if a > 0 then the graph looks like this
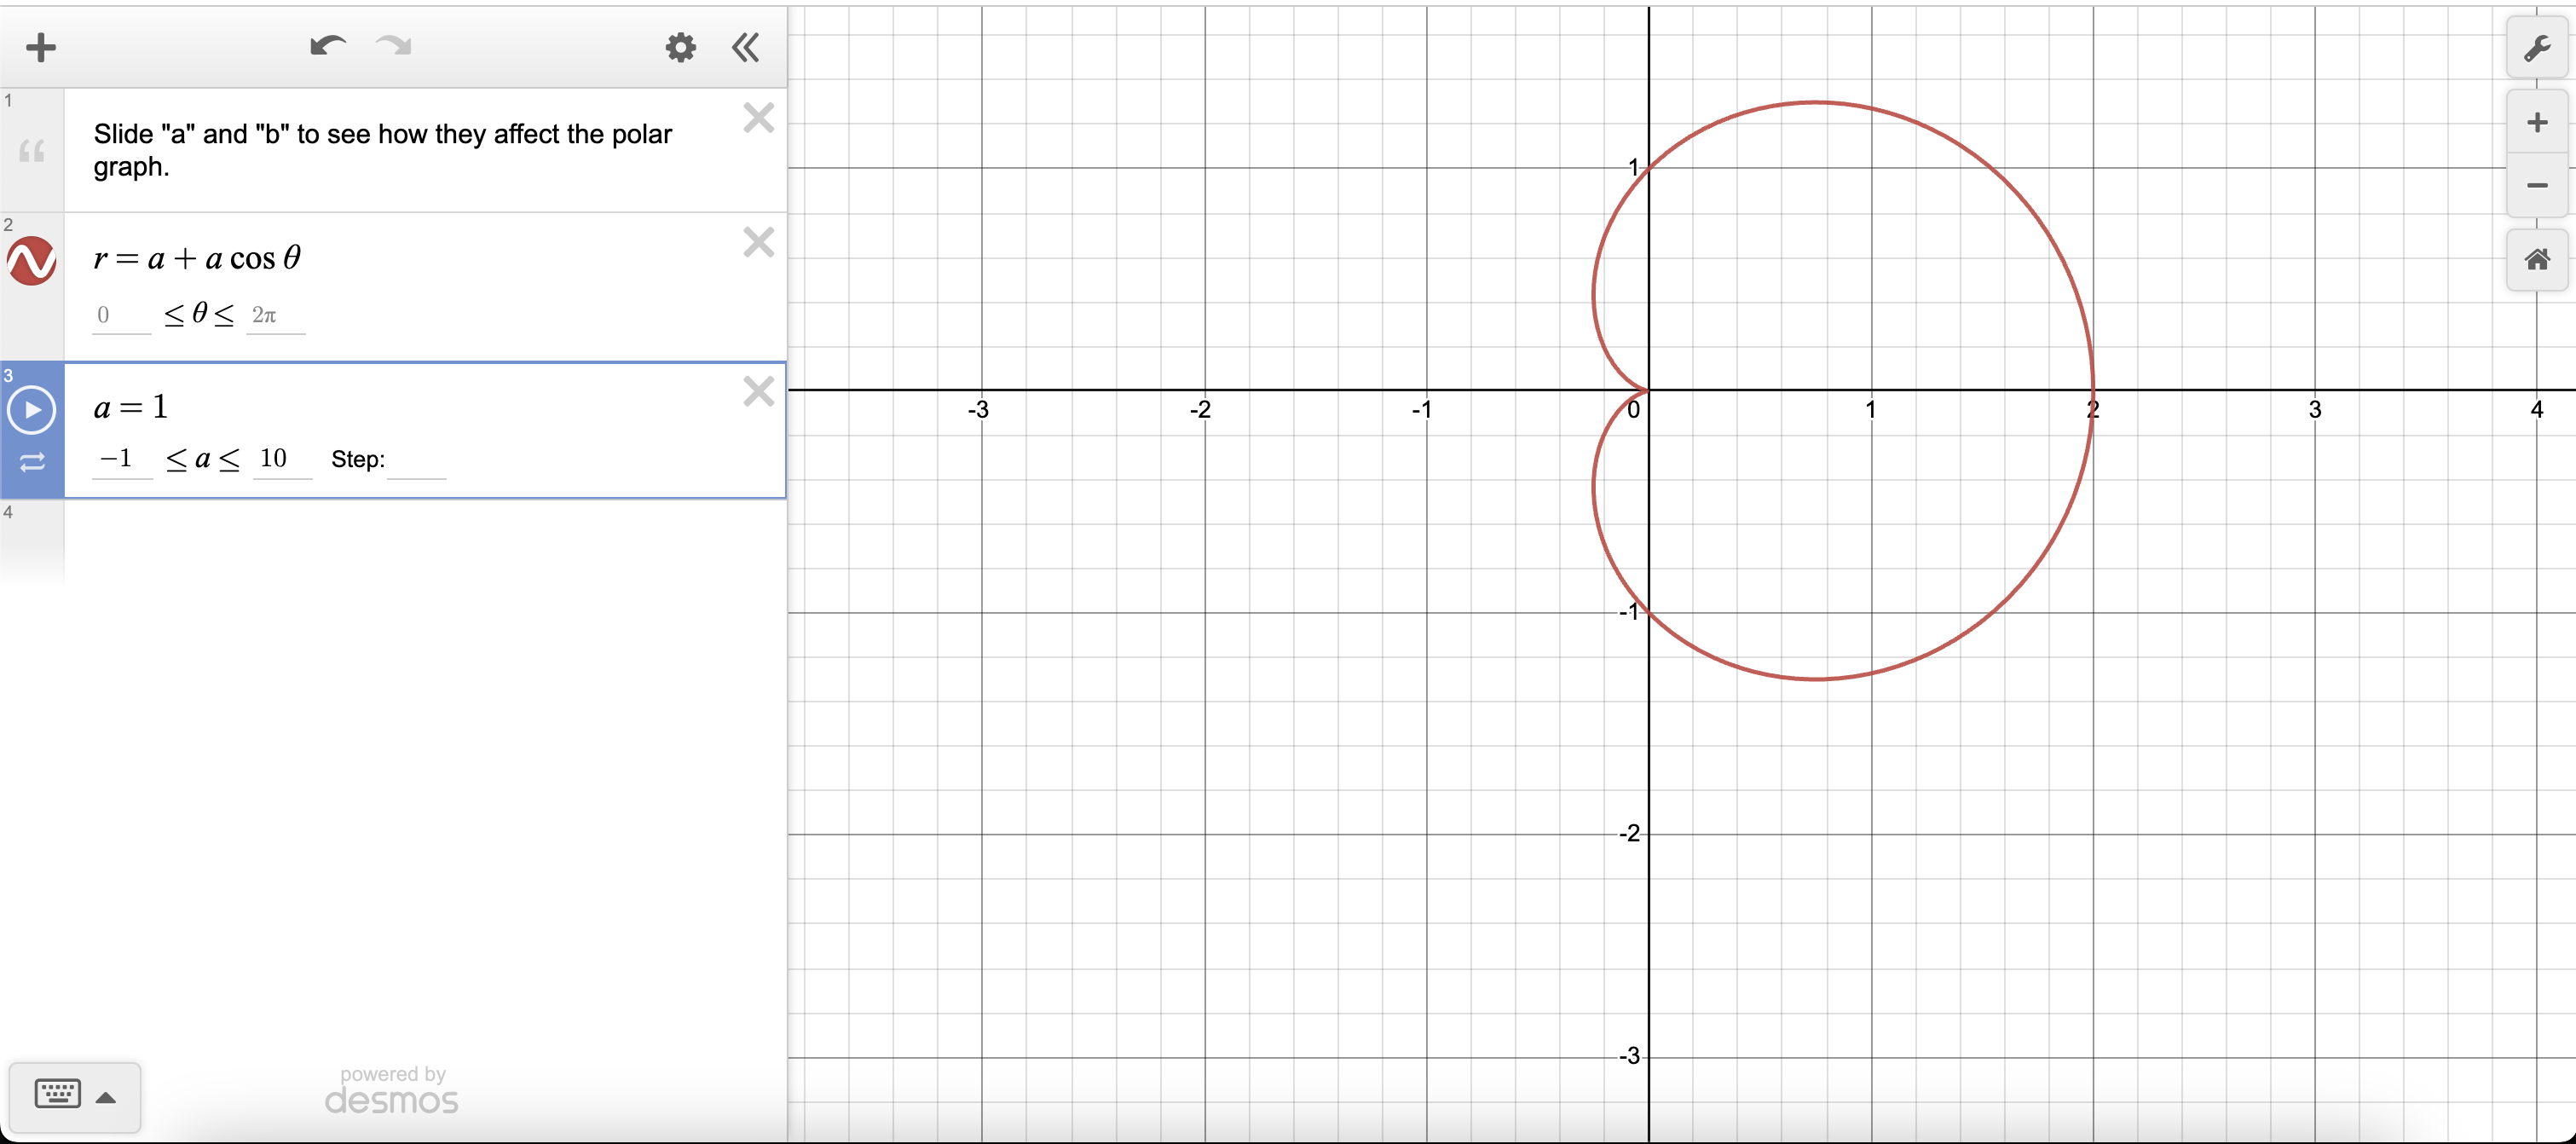
r = a + a cos
Graphs are called cardiods
if a > 0 the graphs look like this
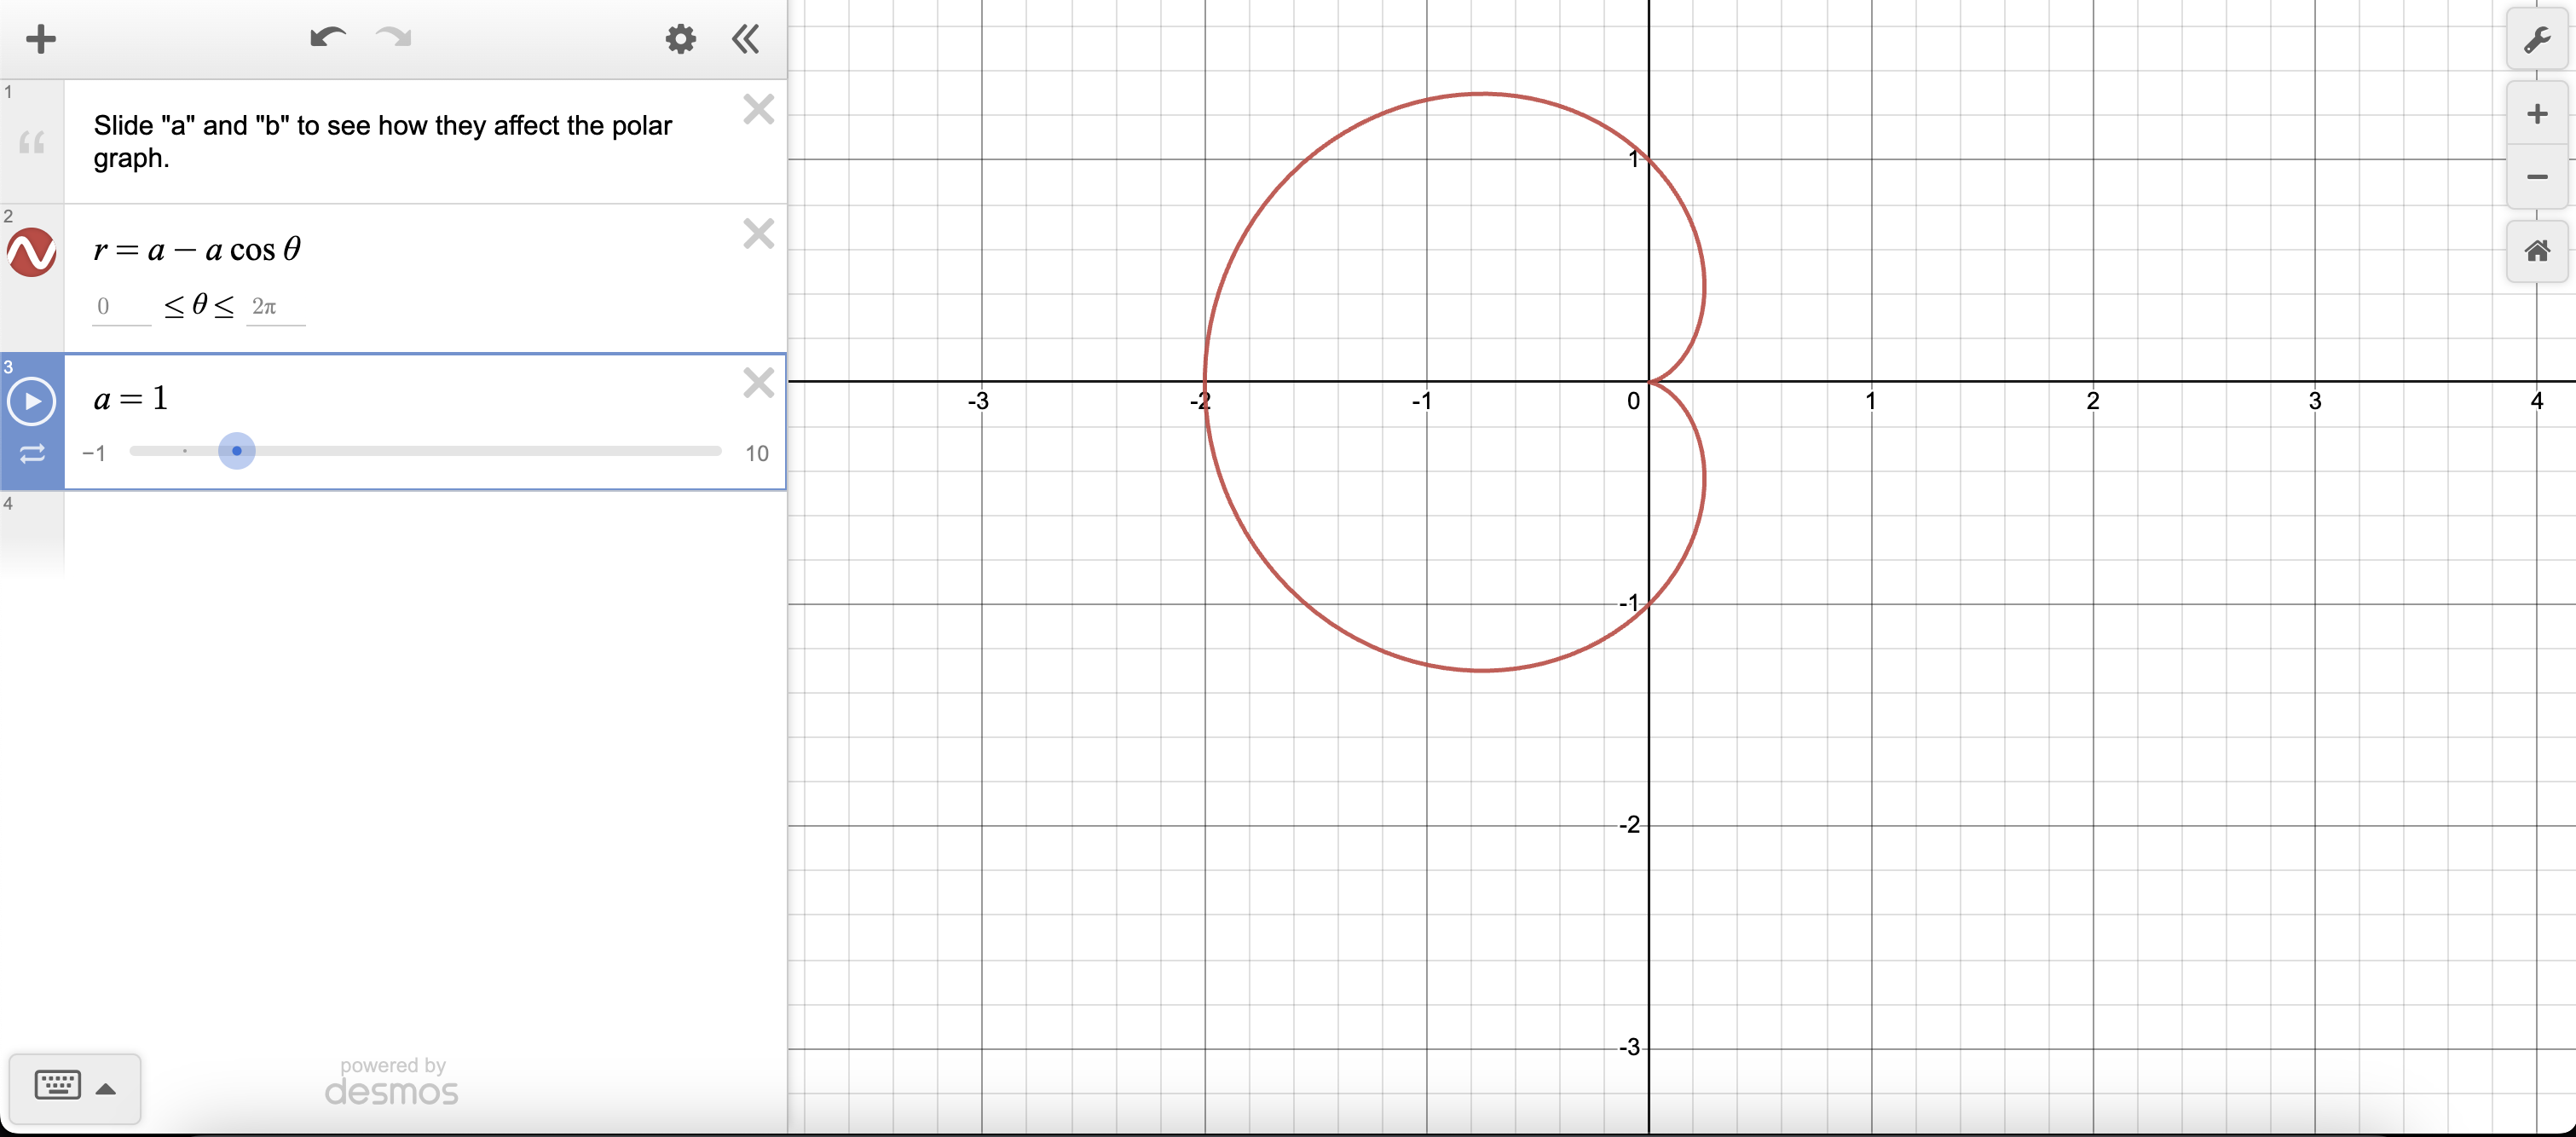
r = a - a cos
Graphs are called cardiods
if a > 0 the graphs look like this
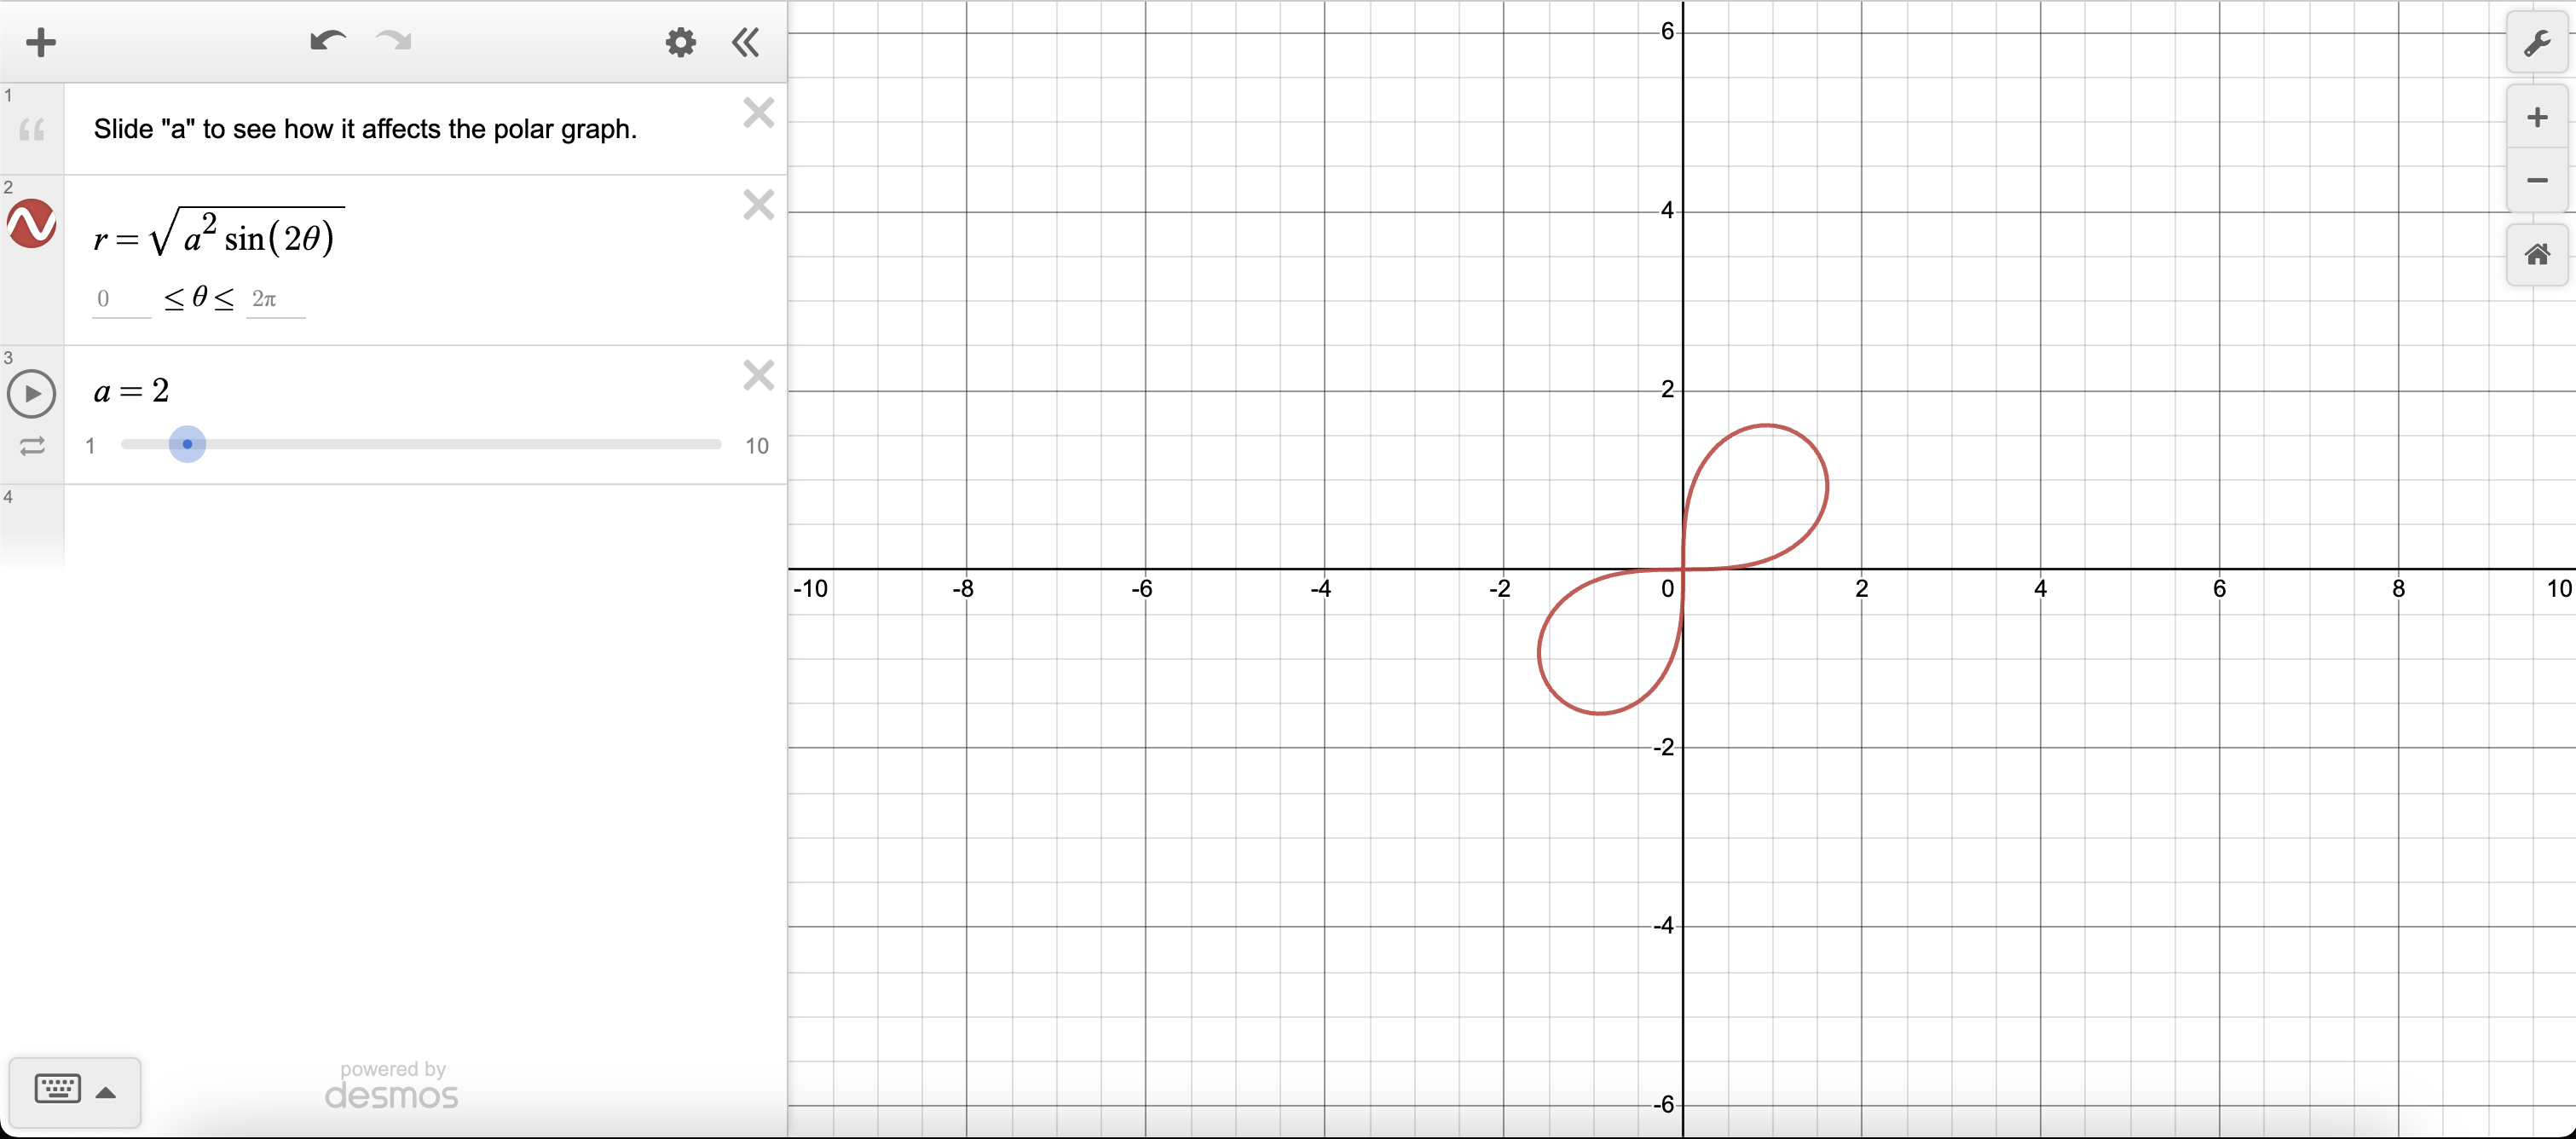
r =
These graphs are called lemniscates
Graphs look like this for any a value (since it’s a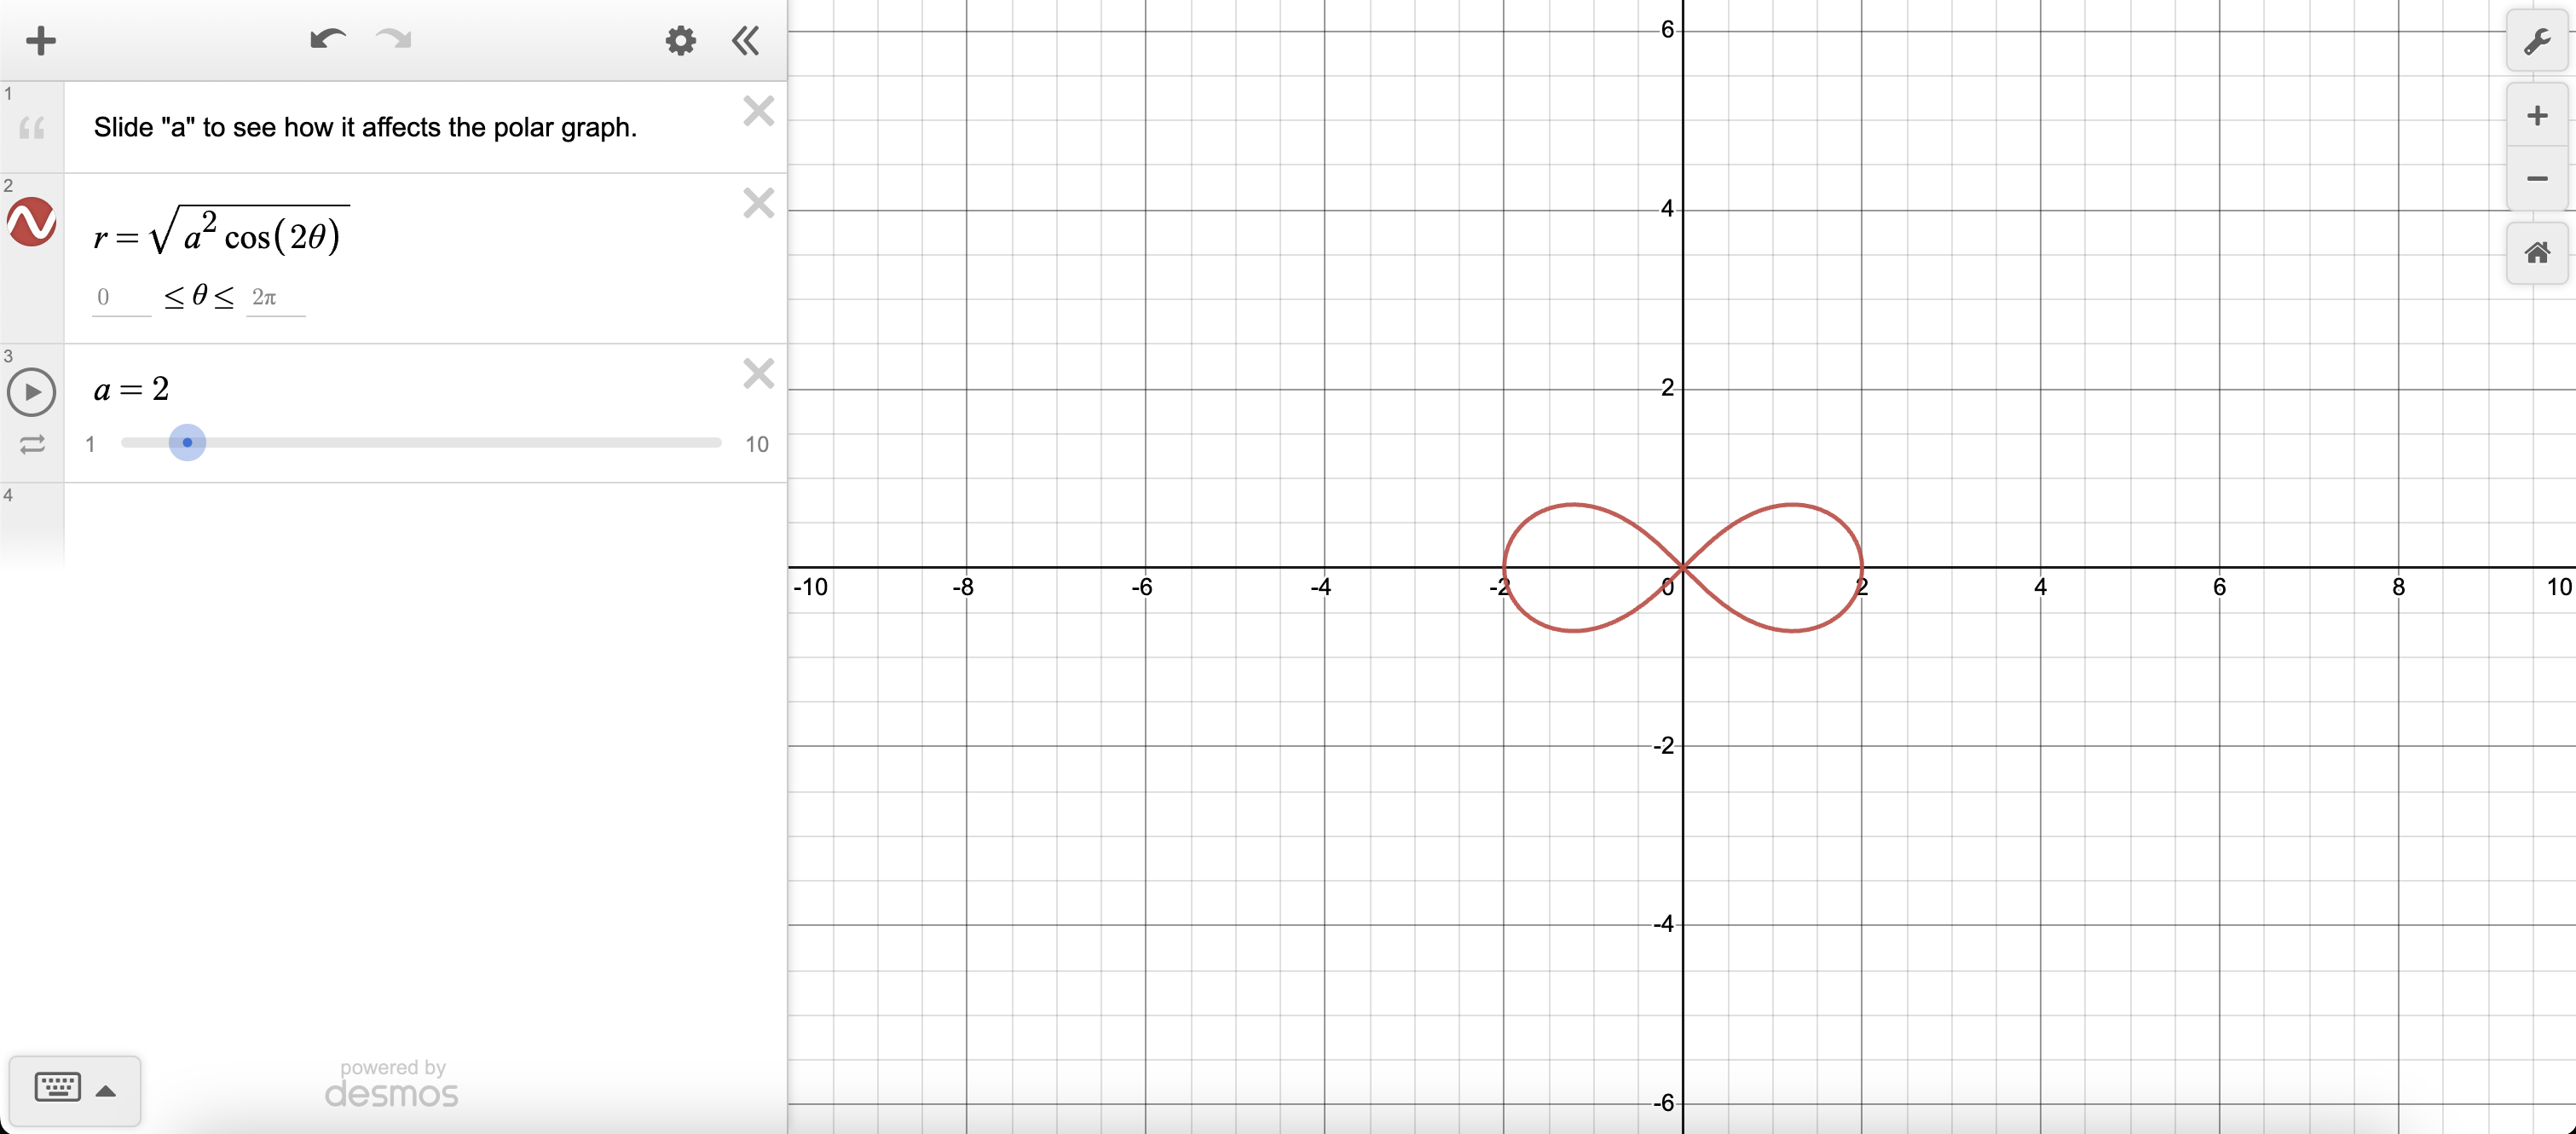
r =
These graphs are called lemniscates
Graphs look like this for any a value (since it’s a